
Figure 1. Fine-mapping analysis of the 22q13.1 region for association with bladder cancer risk.
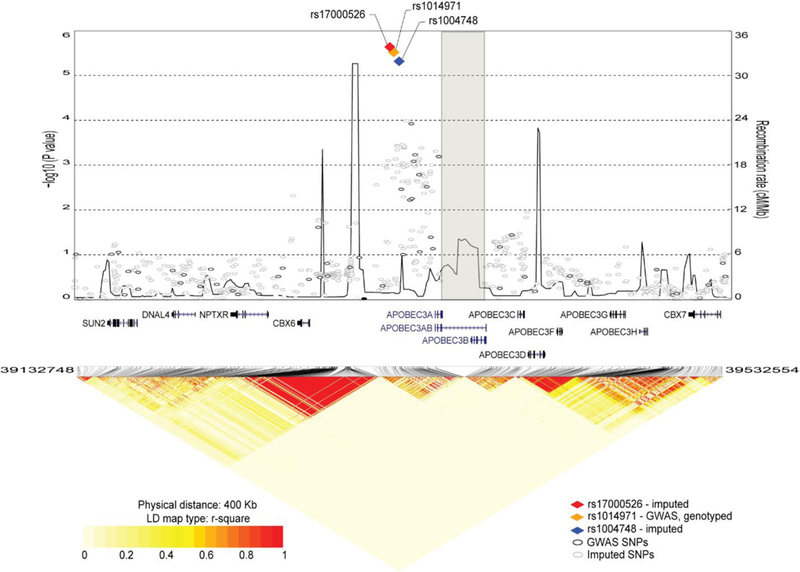
The plot is based on the combined NCI-GWAS1 and NCI-GWAS2 set, which includes 2,301 imputed and 142 genotyped SNPs for 5,832 bladder cancer cases and 10,721 controls of European ancestry. The results are shown for a 400 Kb region centered on GWAS SNP rs1014971, the same region as was used for the eQTL analyses of TCGA data. Left y-axis represents the -log10 (P-values) for association with bladder cancer risk; right y-axis represents the recombination map of the region (cM/Mb), recombination hot spots are connected by line. The SNPs with the strongest signals are presented as colored diamonds; all other SNPs are presented as circles. The position of the deletion is marked by a grey rectangle; APOBEC3AB (A3AB) deletion isoform is labeled within gene track.