
Figure 2. Analysis of factors contributing to APOBEC mutagenesis in bladder and breast tumors in TCGA.
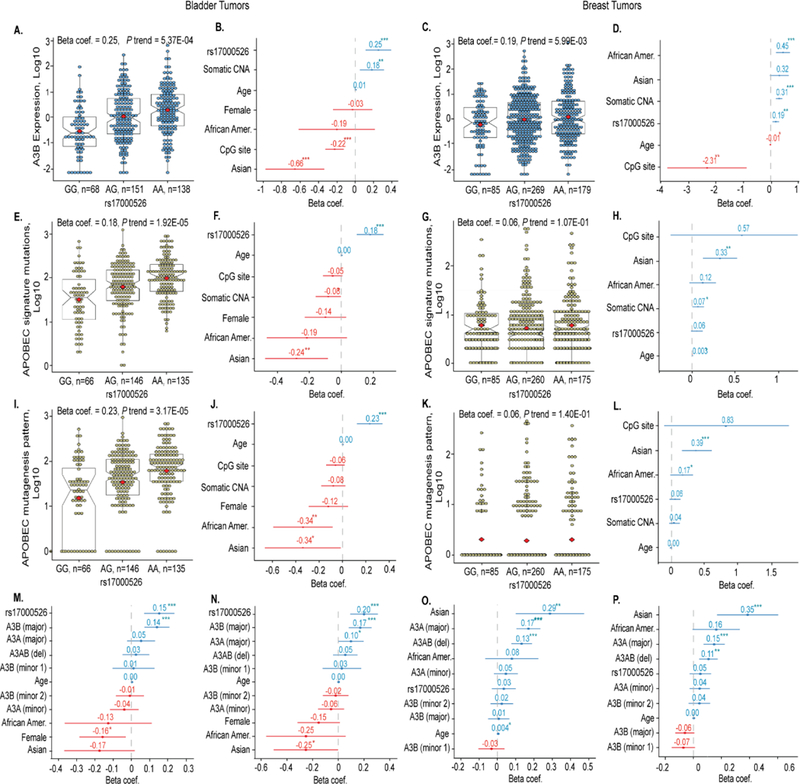
(A-D). Quantile-normalized log10 values of A3B mRNA expression in relation to rs17000526 genotypes and corresponding beta-coefficients for each variable. In box plots, whiskers indicate minimum and maximum range, box overlays indicate first and third quartiles, notches refer to medians, and square overlays (in red) mark the means. (E-H). Log10 values of the APOBEC-signature mutations in relation to rs17000526 genotypes and corresponding beta-coefficients for each variable. (I-L). Log10 values of the APOBEC mutagenesis pattern in relation to rs17000526 genotypes and corresponding beta-coefficients for each variable. (M and O). Beta-coefficients for variables contributing to APOBEC-signature mutations. (N and P). Beta-coefficients for variables contributing to APOBEC mutagenesis pattern. Isoforms are annotated as the major, minor, or deletion (A3AB) transcripts as presented in Supplementary Table 4. Beta-coefficients labeled in blue and red indicate positive and negative correlations, respectively. Male gender and European ancestry are used as reference groups. The CNA represents somatic copy number alterations of A3B. P-values are based on multivariate linear regression analysis: *<0.05; **<0.005, ***<0.0005. Data used for this analysis is presented in Supplementary Data Set 1.