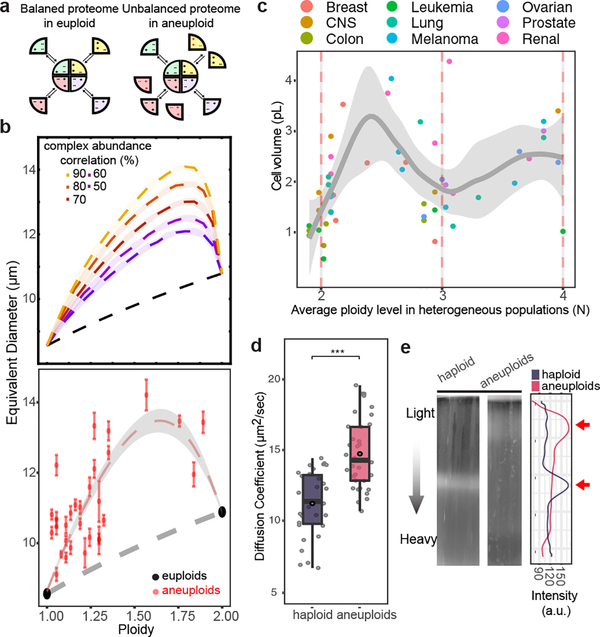
Figure 3 |. Hypo-osmotic stress is a biophysical outcome of proteome imbalance.
a. Schematic representation of proteome imbalance. Left: the euploid state with roughly balanced stoichiometry of proteins that form a multi-subunit complex. Right: the aneuploid state: gene dosage imbalance leads to additional unassembled proteins that cannot form complex due to missing partners. b. Top: cell volume (represented as equivalent diameter) as a function of ploidy levels in aneuploids between 1N and 2N, simulated by assuming different degrees of correlation of the levels of proteins that form complexes. Bottom: cell volume vs ploidy level, measured by using microscopy and FACS, respectively, of euploids and aneuploids (n=30, see Source data for detailed sample size in individual populations; error bars: SEM). Trendlines (centre in b and c, for aneuploids) with 95% CI (ribbon) were obtained by fitting a loess regression to the data. c. Average cell volume vs ploidy level of NCI-60 cancer cell lines (n=54). The trend shown is independent of tissue types (generalized linear model fit: coefficient p-values > 0.05, see Source data for exact p-values). Dots represent averaged cell volume measurements; color scheme of the dots indicates tissue types. Ploidy level of each cell line is estimated from CellMiner database; trendline with ribbon (95% CI) includes the distribution (SD) of single cell volume measurements in each cell line from Dofli et al.30 (Supplementary Table 7). d. Diffusion coefficients of GFP (y-axis) in haploid and aneuploid cytoplasm measured by using fluorescence correlation spectroscopy (FCS). GFP diffusion was significantly faster in aneuploid than in haploid cytoplasm (n= 35 and 32; one-tailed Mann Whitney U-test: p-value =1.63×10⁻⁷). Boxplots are defined as in Fig. 2. e. Density of haploid and heterogeneous aneuploids assessed with density gradient centrifugation (representative results from three biological repeats). Right: cell distribution along the gradient; arrows point to the positions of the majority of cells in the gradient.

