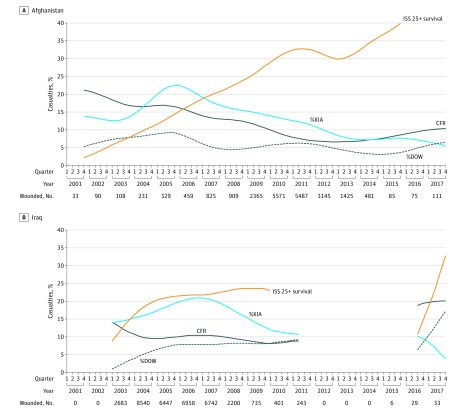
Figure 2. Trends in Combat Casualty Care Statistics.
Percentage survival for critically injured casualties (ISS [Injury Severity Score], 25-75 [ISS 25+]) for Afghanistan (A) and Iraq (B) by using cubic spline estimations smoothed over time from October 2001 through December 2017. The y-axis indicates percentage of casualties. The plot for ISS 25+ survival is truncated for Afghanistan after 2015 and for Iraq after 2009 owing to small sample sizes, which generated unstable spline estimates. The gap in data for Iraq between 2011 and 2016 reflects the absence of combat operations during this period. CFR indicates case-fatality rate; %KIA, percentage who were killed in action; and %DOW, percentage who died of wounds.

