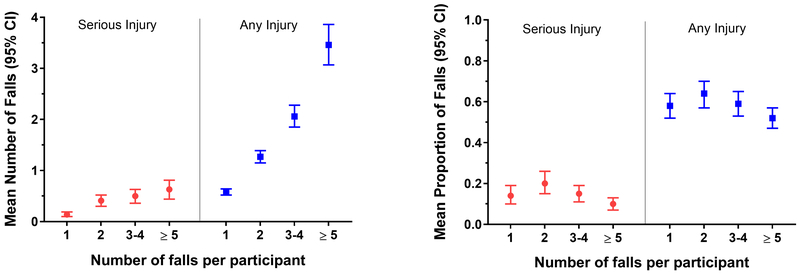
Figure 2.
Number and proportion of falls with injuries per participant by number of falls per participant. The mean number of falls with serious injuries and any injuries increased progressively as number of falls increased (P<.001), and each of the mean values differed statistically (P<.001) from that of the reference group (1 fall). For mean proportion of falls, neither the overall test for association nor any of the pairwise comparisons (with the reference group [1 fall]) were statistically significant.

