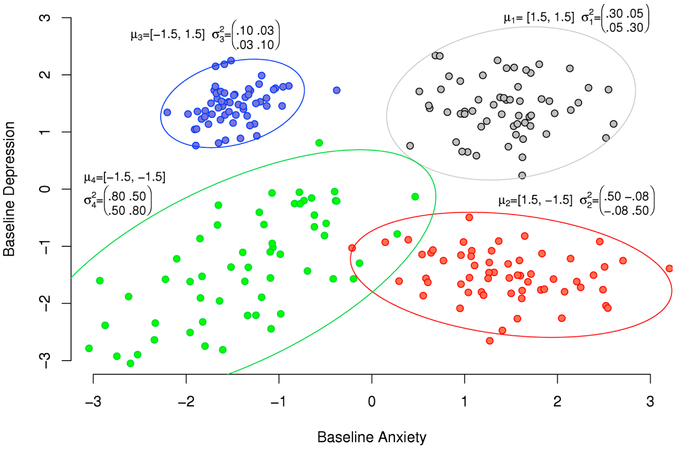
Figure 1:
A hypothetical example of psychological assessment scores from 240 individuals divided into four known clusters. From each cluster, a random sample of 60 individuals is drawn from a bivariate Gaussian distribution with specified mean and covariance matrix. Also plotted are the 95th percentile ellipsoids for the underlying distributions.

