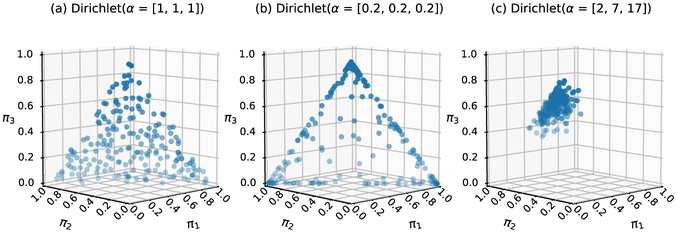
Figure 2:
Examples of Dirichlet priors for a hypothetical mixture model with 3 components. The Dirichlet distribution is the conjugate prior distribution for a categorical variable such as the mixing proportions [π1, π2, π3], plotted on a 3-dimensional simplex. Each symbol represents one possible realization of [π1, π2, π3] arising from the underlying Dirichlet prior. The length of the α parameter defines the number of clusters and the specific parameter values affect how the mixing proportions are distributed. Subplot (a) shows a prior belief that [π1, π2, π3] can take on any triplet seen evenly distributed on the 3-d simplex. Subplot (b) shows a prior belief that the mixing proportions are mostly at the edges of the 3-d simplex, where one mixing proportion is near zero (e.g., [π1, π2, π3] = [0.50, 0.49, 0.01]). Subplot (c) shows a concentration of samples on π3 when α = [2, 7, 17].

