
FIG 1.
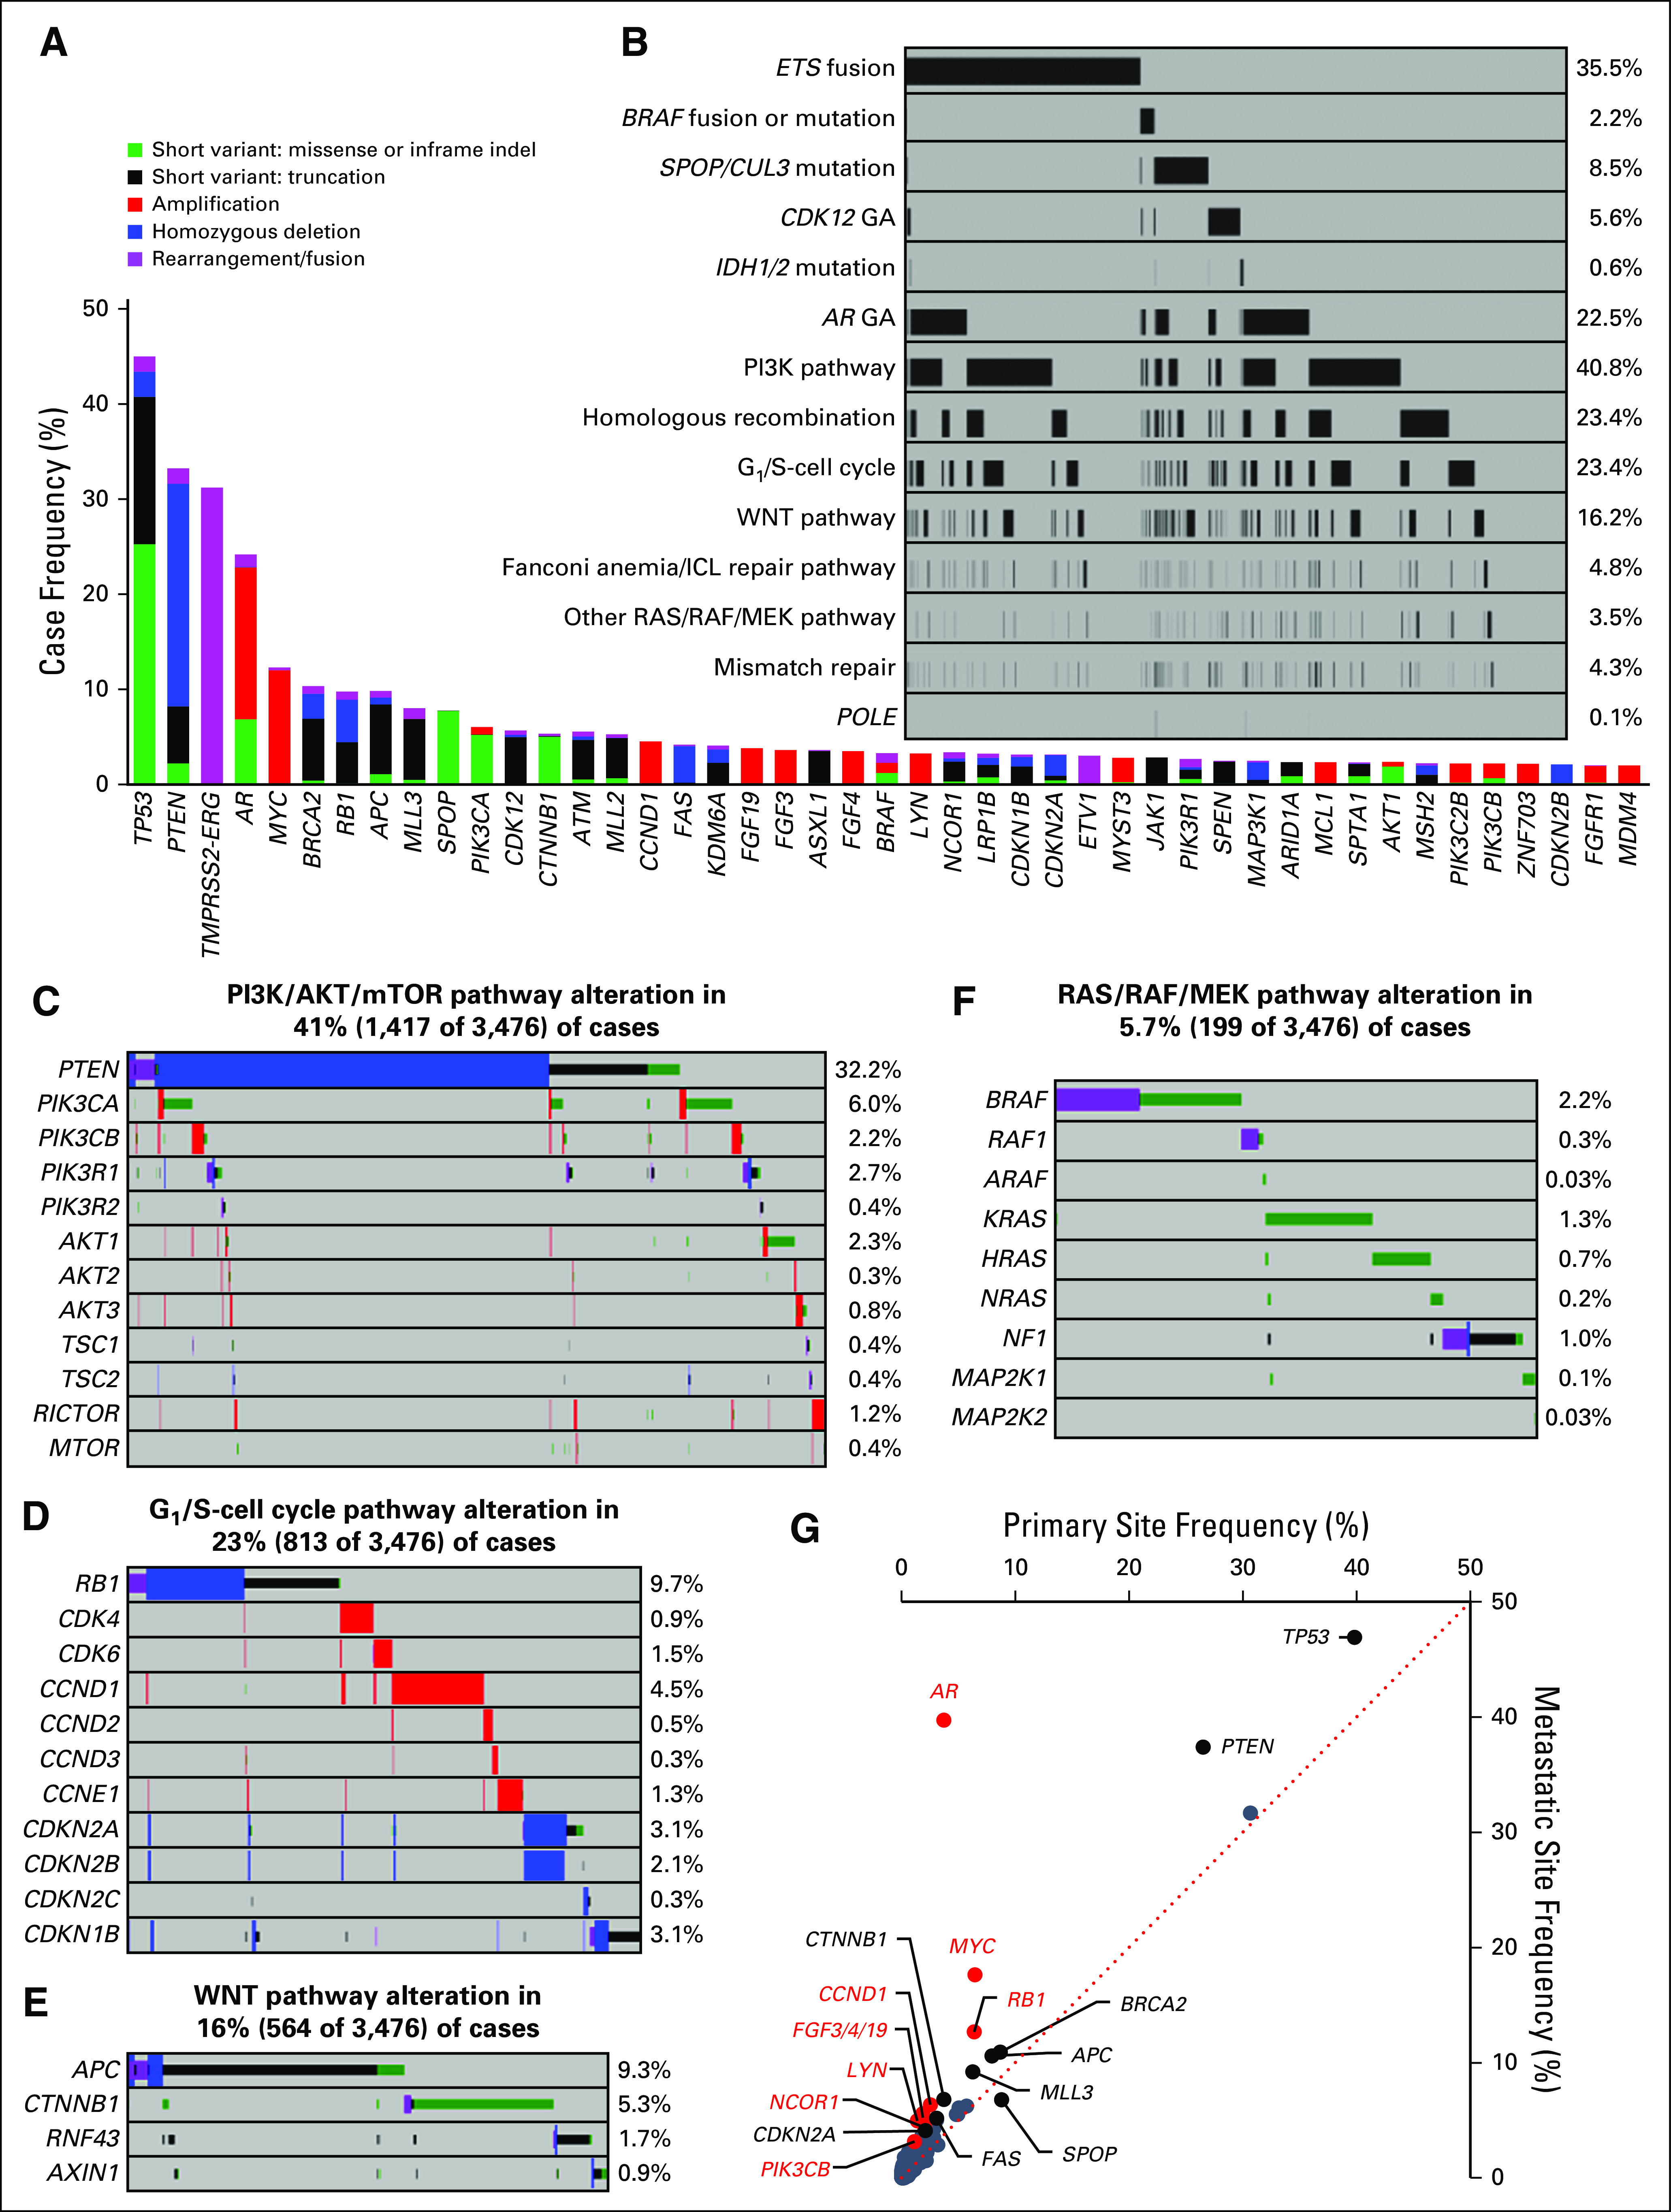
Genomic characterization of primary and metastatic site prostate tumors. (A) The frequency of genomic alterations (GAs) identified in tumors from 3,476 patients with prostate cancer. Genes altered in 2% or more of cases are shown. (B) Frequency of major pathway alterations, including ETS fusions, BRAF rearrangements/mutations, SPOP/CUL3 mutations, CDK12 GAs, IDH1/2 mutations, AR GAs, phosphatidylinositol 3-kinase (PI3K) pathway GAs, homologous recombination GAs, G1/S-cell cycle GAs, WNT pathway GAs, Fanconi anemia/interstrand crosslink repair (FA/ICL) repair pathway GAs, RAS/RAF/MEK pathway GAs (other than BRAF), mismatch repair GAs, and POLE mutations (see Figs 1C to 1F for details). Each column represents a single patient sample, and samples that harbored an alteration in each pathway are indicated in black. (C to F) GAs identified in each pathway, including the (C) PI3K/AKT/mammalian target of rapamycin (mTOR) pathway, (D) G1/S-cell cycle pathway, (E) WNT pathway, and (F) RAS/RAF/MEK pathway (NF1 mutation, rearrangement, or copy number loss; BRAF or RAF1 mutations or rearrangements; ARAF, K/N/H-RAS, or MAP2K1/2 mutations were included); percent of altered cases is indicated. (G) Comparison of alteration frequencies for each gene in primary site samples versus metastatic site samples. The dotted line represents a 1:1 relationship. Genes that were enriched (difference between primary site v metastatic site frequency) by at least 2% are indicated (all P < .05 by Fisher’s exact test [two-tailed]), with genes enriched at least twofold indicated in red (all P < .001 by Fisher’s exact test [two-tailed]). Details are listed in Appendix Table A3. indel, insertion/deletion.