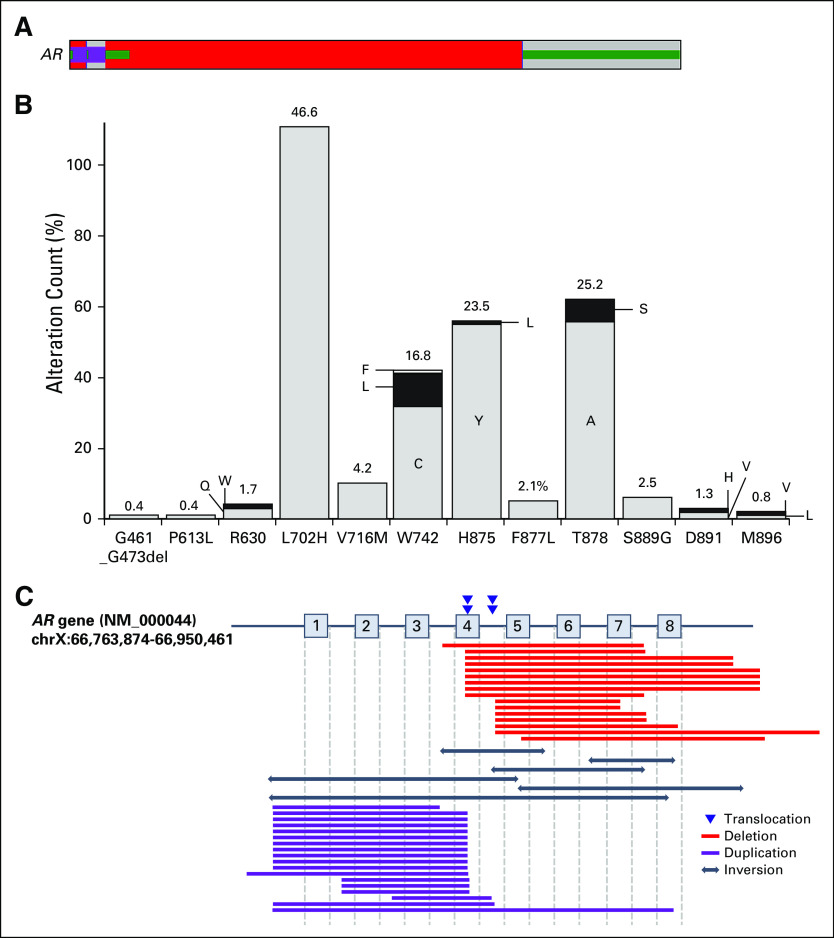
FIG 4.
Landscape of AR alterations. (A) AR genomic alterations (GAs) were identified in 721 cases, including amplification (red), mutation (green), and rearrangements (purple). (B) Graph that represents the number of cases with each AR GA. The percentages indicate the frequency of AR mutations at each codon as a fraction of all AR mutations. Letters denote amino acid abbreviations as recommended by the International Union of Pure and Applied Chemistry. (C) Map of AR rearrangements that describe breakpoints for translocations and deleted, duplicated, or inverted regions.

