Figure 3.
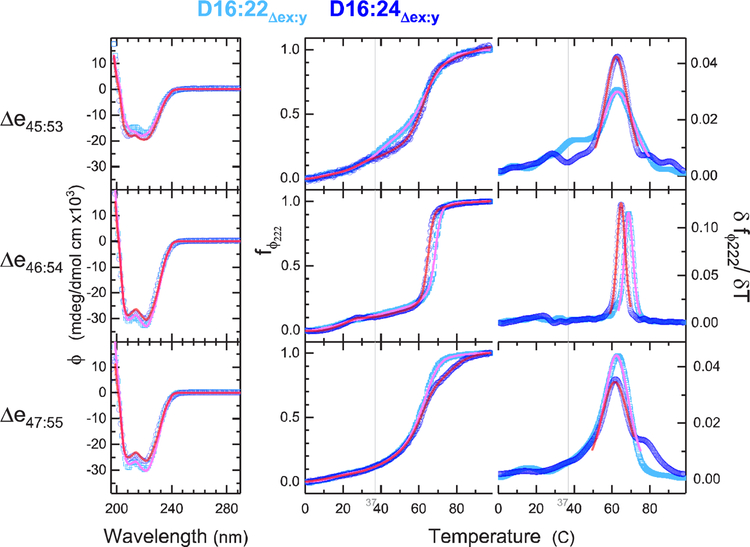
CD structure and stability. CD and thermal denaturation yield secondary structure and unfolding energies as measures of stability. The left panels show CD spectra at 25 °C, with cyan showing D16:22 and blue D16:24 parents. The right panels show raw thermal unfolding profiles and the derivative plots for each system for the temperature range of 0.5–98.5 °C. Fit curves in pink (D16:22) and red (D16:24) show the three-component secondary structure analysis of the CD spectra. Fit curves in the raw thermal denaturation profiles (center) indicate the FFT-filtered data, and the derivative plot (right) shows the thermodynamic fit used to determine Tm and ΔH (which is inversely proportional to peak width). The gray vertical line is at the physiologically relevant temperature of 37 °C. This shows the greater stability of Δe46–54 with respect to the other edits, especially with regard to ΔH as shown by the very sharp transition. Indeed, the other edits are beginning to unfold at physiological temperatures.

