
Table 2.
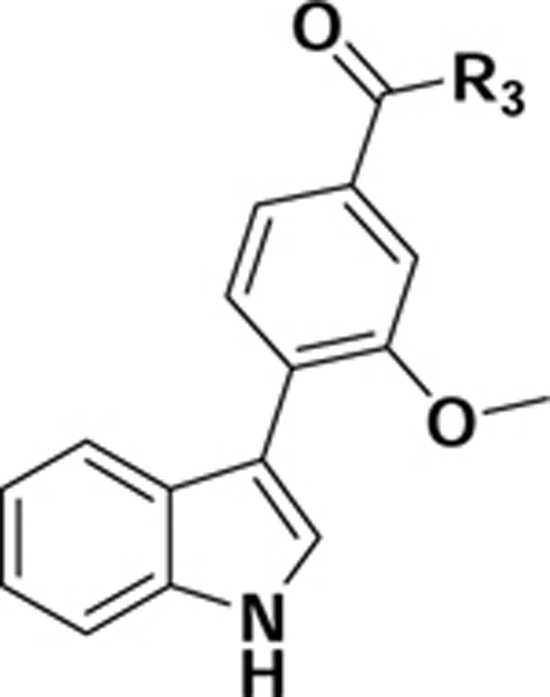
Binding Affinities of the Derivatives 13a-e.
 | ||||
|---|---|---|---|---|
| Compounds | R | logD7,4 | % Binding inhibition a (concentration) | |
| (10−9M) | (10−8M) | |||
| 13a |  |
0.7 | 15.7 | 4.7 |
| 13b |  |
1.6 | 13.7 | 9.0 |
| 13c |  |
0.2 | 5.7 | 6.2 |
| 13d |  |
5.8 | 7.4 | 4.8 |
| 13e |  |
3.2 | 5.0 | 4.6 |
a
Values are the means of % inhibitions of two independent experiments, each in duplicate.