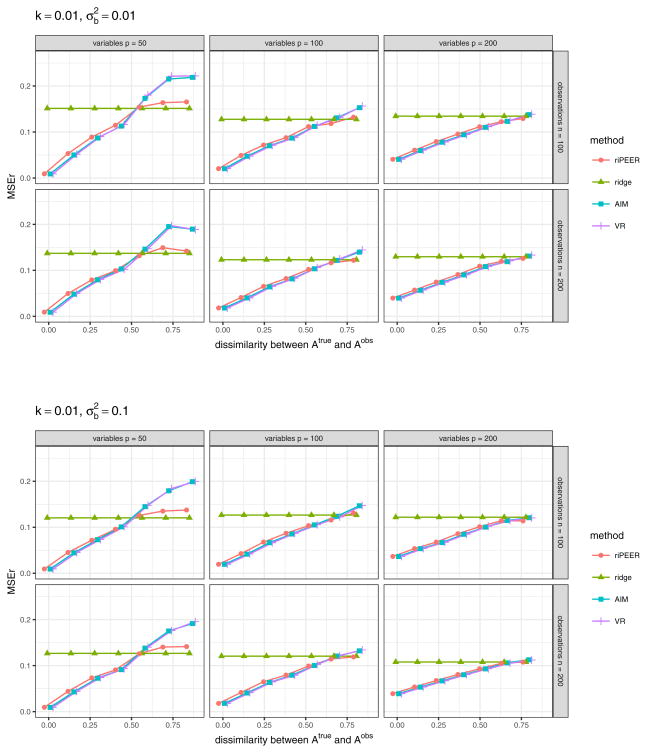
Fig. 19.
b estimation relative error values obtained in numerical experiments with the partially informative connectivity information input (graph rewiring with constant probability for an edge to be rewired) for REML estimation methods: riPEER, ridge, AIM, VR. Error values are aggregated (median) out of 100 experiment runs for different combinations of simulation setup parameters: number of variables p ∈ {50, 100, 200} (left, central and right panels in each plot, respectively), number of observations n ∈ {100, 200} (top and bottom panels in each plot, respectively), level of dissimilarity between 𝒜true and 𝒜obs diss marked by x-axis labels, strength of correlation between the variables in the Z matrix k, signal strength . Here, k = 0.01 (both upper and bottom plot), (upper plot) and (bottom plot).

