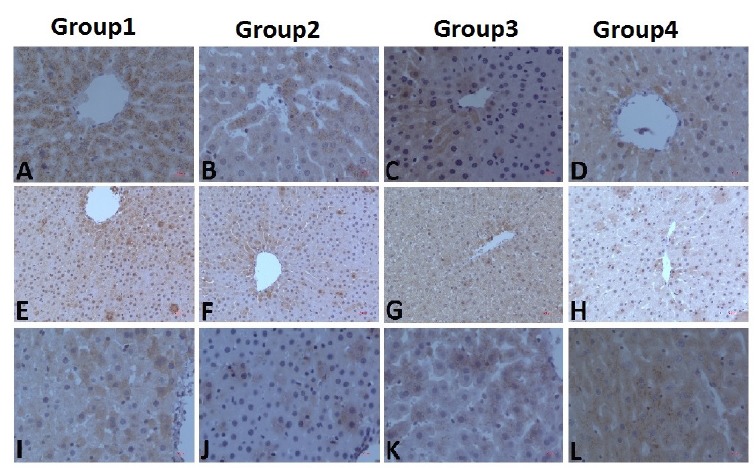
Figure 2. IHC stainings of all groups were shown. While A, B, C and D are iNOS staining images, E, F, G and H are TNF-α and I, J, K and L are IL-10 staining images of groups. Magnification for A, B, C, D, I, J, K and L is x400, for E, F, G and H is x200.

