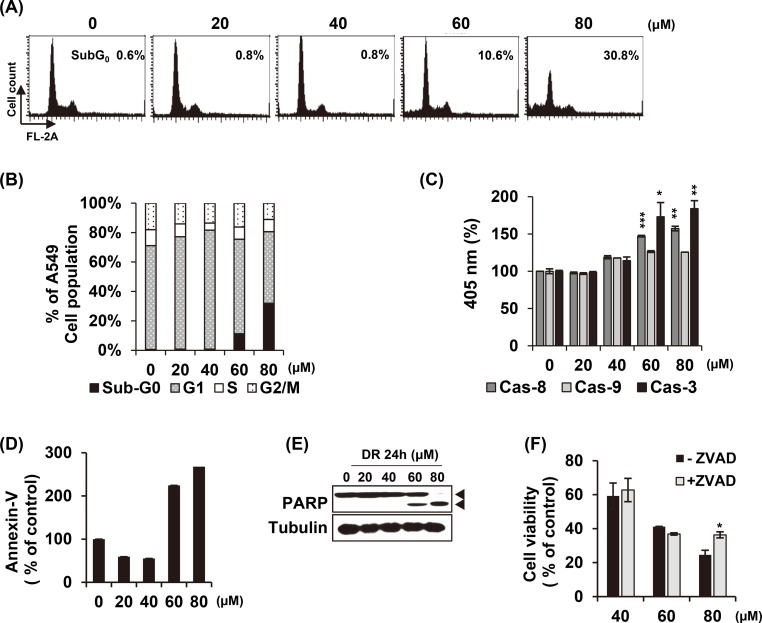
Fig 2. DR induces non-apoptotic cell death at low concentrations.
(A) DR was treated with various concentration for 24 h, and cell cycle analysis was performed using flow cytometry. (B) The cell cycle distribution was quantified and represented as a bar graph. (C) After 24 h incubation with the indicated concentrations of DR, the A549 cells were lysed and aliquots were assayed for in vitro caspase-8, - 9 and -3 activity. (D) After DR treatment for 24 h, the cells were stained with Annexin V. Early apoptotic Annexin V-positive cells were detected by flow cytometry. (E) After treatment of DR with the indicated concentrations, the cells were lysated and analyzed by western blotting. (F) Cells were co-treated with pan caspase inhibitor (Z-VAD-fmk, 20 μM) and cell viability were measured by MTT assay. Statistical differences were presented p<0.05 (*), p<0.01 (**), and p<0.001 (***) compared with the DR alone; p<0.01 (##) compared with the DMSO control.

