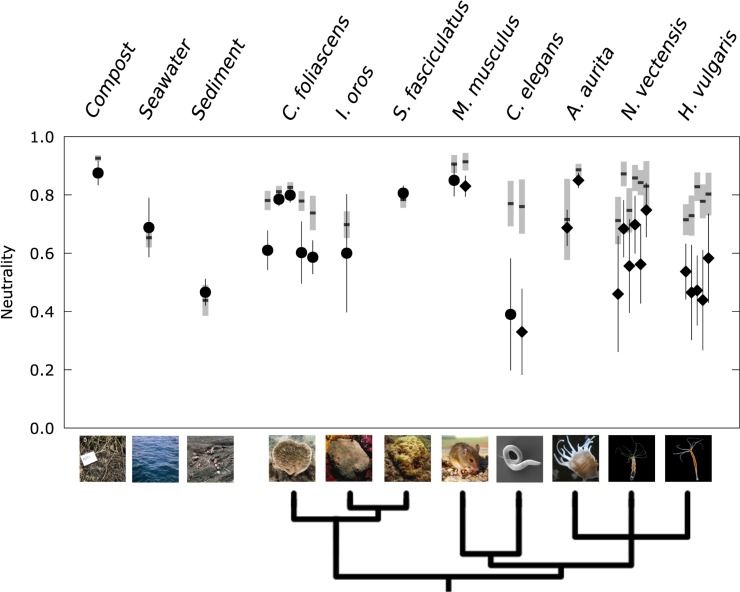
Fig 3. Goodness of fit of the neutral expectation to a range of host-associated and environmental communities.
Circles denote natural populations and diamonds denote laboratory populations; error bars indicate 95% bootstrap confidence intervals. The gray bars indicate the 95% bootstrap confidence intervals around the expected goodness of fit (horizontal black line) to a neutral simulation, providing a comparison to a completely neutral community with the same sample size and diversity. The data for C. foliascens are from several different natural populations, while the data for H. vulgaris and N. vectensis are from different time points. The spread of points along the x-axis is added to increase visibility. The data used to generate this figure are available in S7 Data. Phylogeny were generated with phyloT based on NCBI taxonomy. Sponge photographs courtesy of Susanna López-Legentil (UNC Wilmington) and Mari-Carmen Pineda (AIMS). AIMS, Australian Institute of Marine Science; NCBI, National Center for Biotechnology Information; UNC, University of North Carolina.

