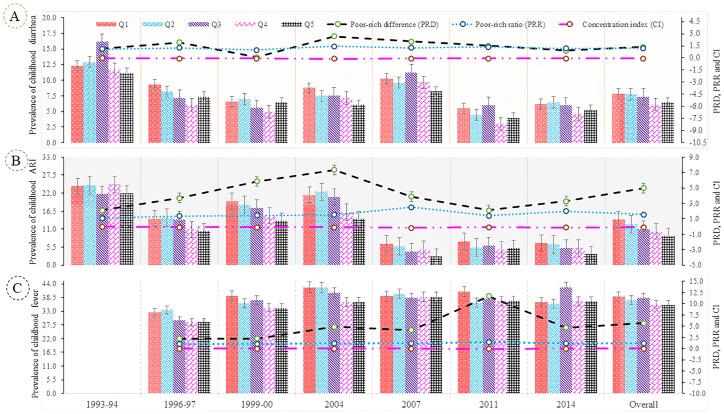
Fig 2. Distribution of childhood morbidity across scio-economic groups, 1993–2014.
(A) Expressing the prevalence of childhood diarrhea and inequalities in terms of poor-rich difference (PRD), poor-rich ratio (PRR) and Erreygers’s concentration index (CI) (B) Presenting the prevalence of childhood acute respiratory infection (ARI) and inequalities in terms of PRD, PRR and CI (C) Showing the prevalence of childhood fever and inequalities in terms of PRD, PRR and CI.

