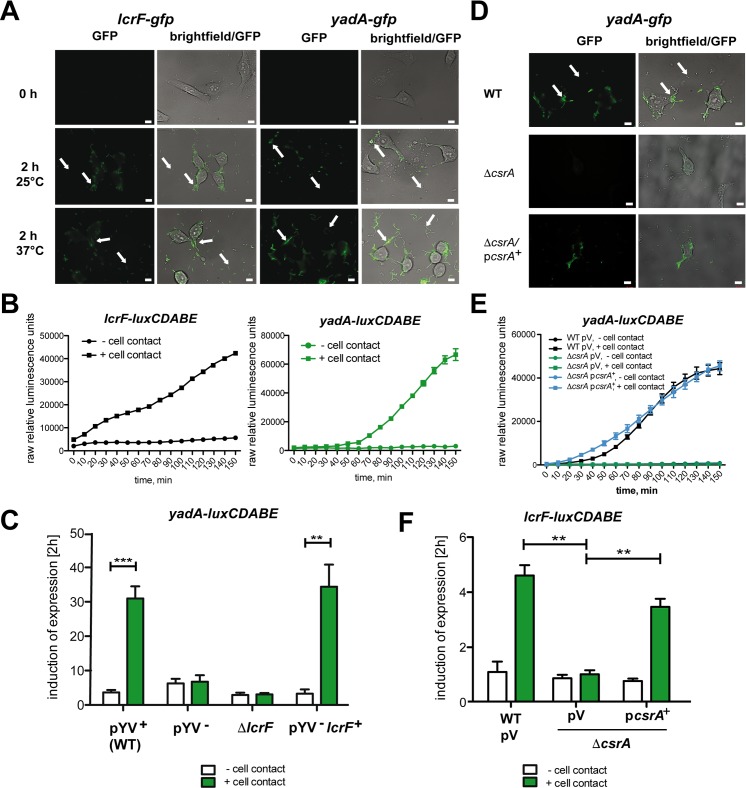
Fig 1. CsrA-dependent, host cell contact-mediated induction of yadA and lcrF expression.
(A) HEp-2 cells infected with Y. pseudotuberculosis wildtype strain YPIII harboring a plasmid-encoded yadA-gfp (pJE9) or a lcrF-gfp fusion (pWO3) were incubated for at least 2 h at 25°C or 37°C. Arrows indicate bacteria in contact and without contact to host cells. White bars indicate 5 μm. (B) Strain YPIII harboring a plasmid-encoded yadA-luxCDABE (pWO41) or a lcrF-luxCDABE fusion (pWO42) were incubated with or without HEp-2 cells for 2.5 h at 25°C. Bioluminescence of the samples was monitored every 10 min to determine the kinetics of host cell contact-dependent expression of the reporter fusions. (C) Strains YPIII (WT), YP12 (pYV-), YP66 (ΔlcrF) and YP155 (pYV-, lcrF+) harboring the yadA-luxCDABE fusion plasmid pTS31 were used to infect HEp-2 cells or were incubated in PBS incubated without cells at 25°C. Bioluminescence of the samples was monitored after 2 h. The data represent the mean ± SEM of the fold change (end/start) from three independent biological replicates and were analyzed with Student’s t-test. **: P<0,01, ***: P<0,001. (D) HEp-2 cells infected with YPIII (WT), YP53 (ΔcsrA) and YP53 pAKH56 (csrA+) harboring a yadA-gfp fusion (pJE9) were incubated for 4 h at 25°C. Arrows indicate bacteria with and without contact to host cells. White bars indicate 5 μm. (E) Strains YPIII pV (empty cloning vector pHSG576), YP53 (ΔcsrA) pV and YP53 pKB60 (csrA+) harboring a plasmid-encoded yadA-luxCDABE (pWO41) were incubated with or without HEp-2 cells at 25°C. Bioluminescence of the samples was monitored every 10 min to determine the kinetics of host cell contact-dependent expression of the reporter fusions. (F) Strains YPIII, YP53 (ΔcsrA) pV (empty cloning vector pHSG576) and YP53 pKB60 (csrA+) harboring a plasmid-encoded lcrF-luxCDABE (pWO42) were applied to infected HEp-2 cells or incubated in PBS without cells at 25°C. Bioluminescence of the samples was monitored after 2 h. The data represent the mean ± SEM of the fold change (end/start) from three independent biological replicates and were analyzed with Student’s t-test. **: P<0,01.

