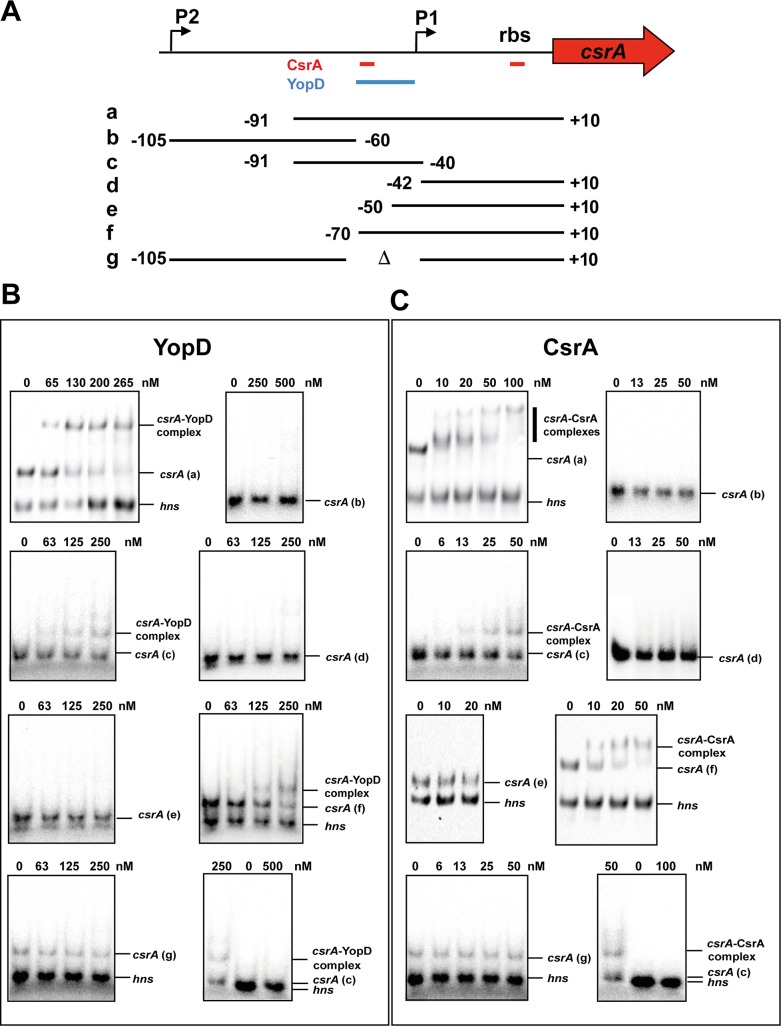
Fig 5. Interaction of CsrA and YopD with the csrA transcript.
(A) Schematic overview of the csrA locus and the generated csrA transcript fragments used for the RNA binding assay in B-C. The two promoters identified by a previous RNA-Seq analysis [38] are indicated by broken arrows. The identified CsrA and YopD binding sites are indicated with red and blue bars. The numbers indicate the nucleotide positions with respect to the translation initiation site of csrA. The alphabetic characters indicate the transcripts used in B-C. (B) The in vitro generated transcript (a) was incubated with increasing amounts (left panel) and transcripts (b)-(d) were incubated with a defined (650 nmol, right panel) amount of purified YopD. The csrA-YopD complex is indicated. c: The hns transcript was used as negative control. (C) The in vitro generated transcripts a (left panel), f and e (right panel) were incubated with increasing amounts of purified CsrA. The csrA-CsrA complex is indicated. c: The hns transcript was used as negative control.

