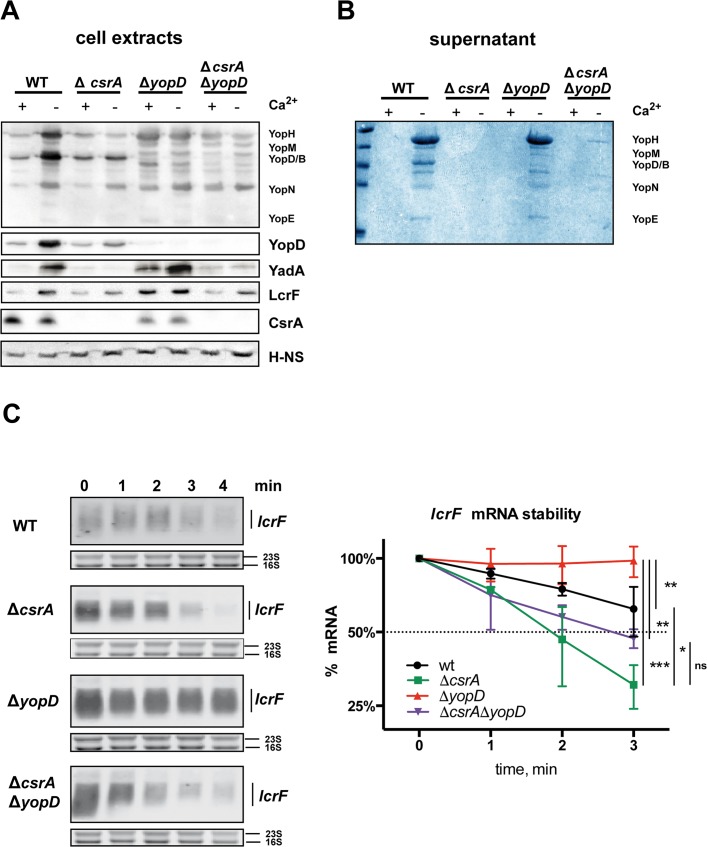
Fig 6. Influence of CsrA and YopD on the expression of Yops, YadA and LcrF.
Strains YPIII, YP53 (ΔcsrA), YP91 (ΔyopD), and YP145 (ΔcsrA, ΔyopD) were grown in LB at 37°C in the absence (non-secretion conditions) or presence of 20 mM MgCl2 and 20 mM sodium oxalate for 4 h (secretion conditions). (A) Whole cell extract of the bacterial cultures were prepared and analyzed by western blotting with polyclonal anti-Yop, anti-YadA, anti-LcrF, anti-YopD or anti-CsrA antibodies. H-NS detected with polyclonal anti-H-NS served as loading control. (B) In parallel, proteins in the supernatant were precipitated with TCA, separated by SDS polyacrylamide electrophoresis and stained with Coomassie blue. A lcrF mutant was used as control. (C) To determine the stability of the lcrF mRNA rifampicin was added to cultures of YPIII, YP53 (ΔcsrA), YP91 (ΔyopD), and YP145 (ΔcsrA, ΔyopD) grown at 37°C to stop transcription. Samples of the cultures were taken directly (0 min) and 1, 2, 3, and 5 min after rifampicin treatment. Total RNA of the samples was prepared and subjected to northern blotting using an lcrF specific probe. The 16S and 23S rRNAs served as loading controls. A representative of at least three independent experiments is presented (left panel). The lcrF transcript levels were quantified using the ImageJ software and plotted to determine the mRNA degradation rate (right panel). The band intensity for the 0-min sample was set to 100%, and other samples were normalized to the 0-min sample. The data represent the mean ± SD from three independent biological replicates. The end point was analyzed using ANOVA with Dunnetts post-test for multiple comparisons. *: P<0,05, **: P<0,01; ***: P<0.001; ns: not statistically significant.

