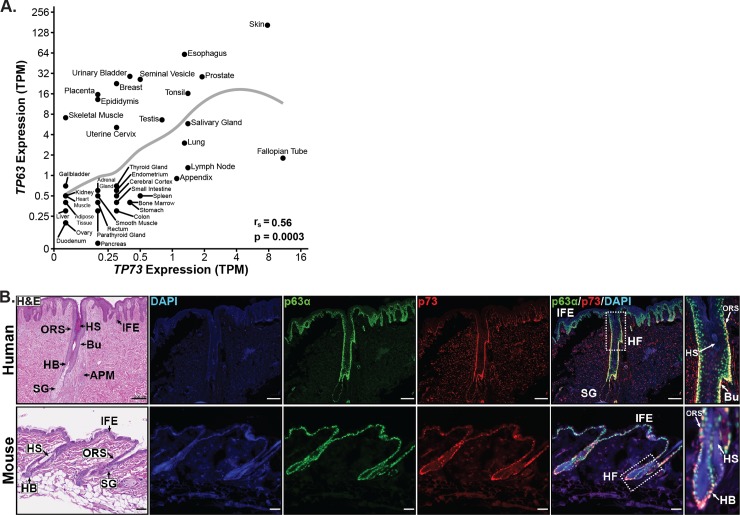
Fig 1. Analysis of p73 and p63 co-expression in human and murine skin.
(A) Scatter plot of TP63 versus TP73 RNA-seq expression [units = transcripts per million (TPM)] by human tissue type (n = 37) from the Human Protein Atlas (172 total samples) [30]. Mean expression (TPM + 0.1) for each tissue is plotted on a log2 scale with a LOESS smooth local regression line (gray). Correlation between TP63 and TP73 was quantified using Spearman’s rank correlation coefficient (rs). (B) Representative micrographs of H&E and immunofluorescence (IF) staining on serial human (top) and mouse (bottom) skin sections; DAPI (blue), p63α (green), and p73 (red). Regions of the skin in micrographs are labeled as: interfollicular epidermis (IFE), hair follicle (HF), outer root sheath (ORS), HF bulge (Bu), hair bulb (HB), sebaceous gland (SG), hair shaft (HS), and arrector pili muscle (APM). Scale bars represent 200 μm for human and 50 μm for murine tissue. See also S1 and S2 Figs.

