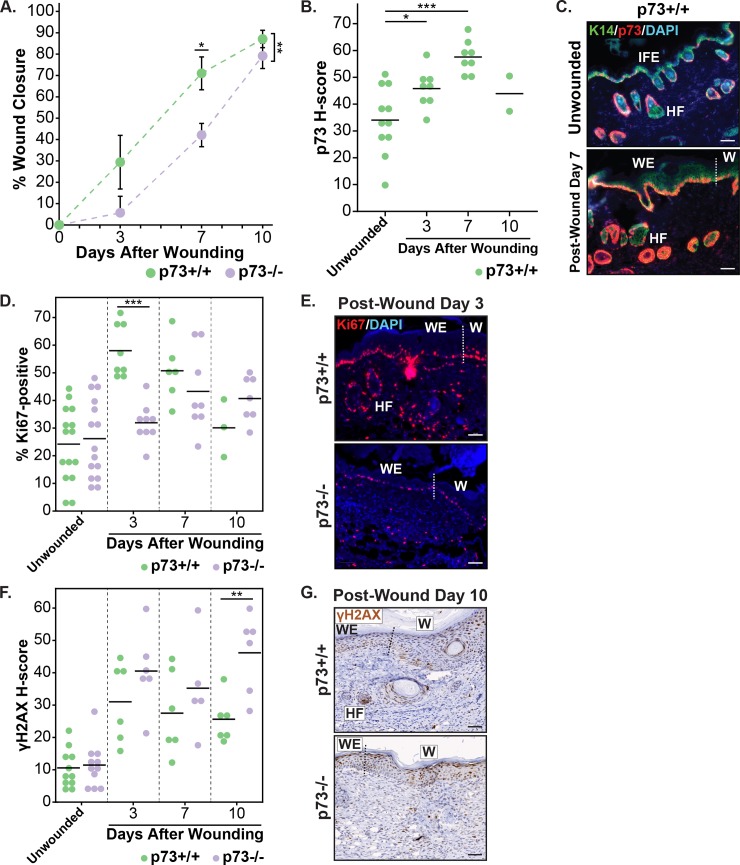
Fig 2. Biological and molecular analysis of cutaneous wound healing in p73+/+ and p73-/- mice.
(A) Graph of percentage wound closure relative to initial wound size in p73+/+ and p73-/- mice at 0, 3, 7, and 10 days after wounding. The mean area of eight wounds is shown with error bars representing SEM. (B) Dot plot of p73 H-score in unwounded and wounded (days 3, 7, and 10) skin specimens from p73+/+ mice. (C) Representative micrographs of IF staining for K14 (green), p73 (red), and DAPI (blue) in unwounded and post-wound day 7 skin specimens from p73+/+ mice. (D) Dot plot of the percentage of Ki67-positive cells in unwounded and wounded (days 3, 7, and 10) skin specimens from p73+/+ and p73-/- mice. (E) Representative micrographs of IF staining for Ki67 (red) and DAPI (blue) in skin specimens from p73+/+ and p73-/- mice 3 days after wounding. (F) Dot plot of γH2AX H-score in unwounded and wounded (days 3, 7, and 10) skin specimens from p73+/+ and p73-/- mice. (G) Representative micrographs of immunohistochemistry (IHC) staining for γH2AX in skin specimens from p73+/+ and p73-/- mice 10 days after wounding. All scale bars represent 50 μm. In (B), (D), and (F), horizontal lines represent the mean. In (C), (E), and (G), regions of the skin are labeled as: IFE, HF, epidermal wound edge (WE), and newly-formed epidermis of the wound (W); and the dotted line indicates the border between the WE and W. *p-value < 0.05, **p-value < 0.01, ***p-value < 0.001. See also S3 and S4 Figs.

