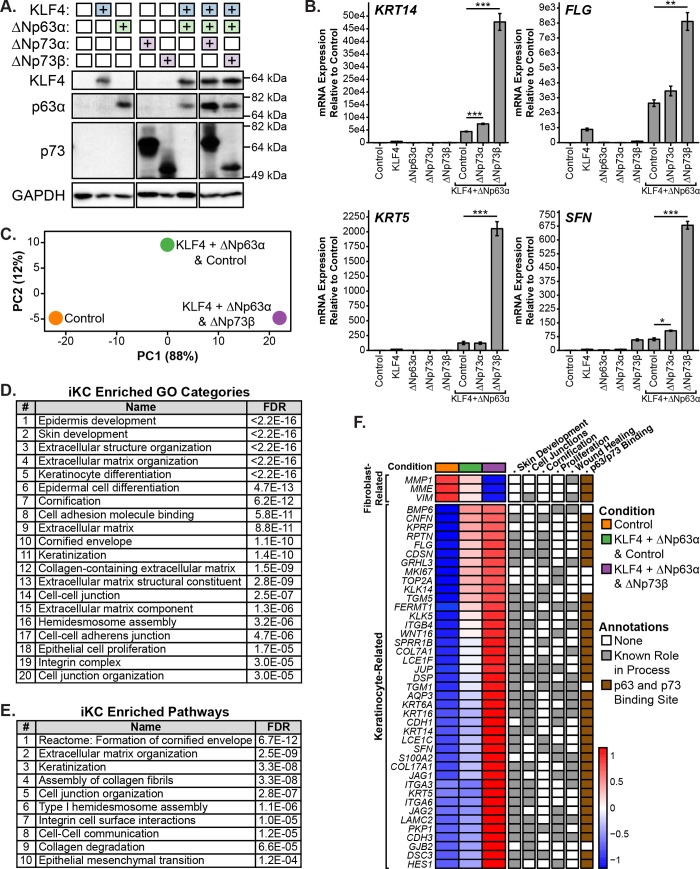
Fig 4. Analysis of ΔNp73 in epidermal programming using an induced basal keratinocyte (iKC) model system.
(A) Immunoblot of KLF4, p63α, and p73 protein expression in neonatal human dermal fibroblast (HDFn) cells infected with lentivirus encoding ΔNp73 isoforms (ΔNp73α and ΔNp73β) or empty vector control in combination with KLF4 and ΔNp63α. Cells were grown for 3 days and protein was harvested for immunoblot analysis. (B) Bar graphs of RNA expression for the indicated keratinocyte genes in HDFn cells infected in (A). Cells were grown for 3 days and RNA was harvested for qRT-PCR analysis. Expression data are represented as the fold increase relative to control. The mean of three replicates is shown with error bars representing SEM. *p-value < 0.05, **p-value < 0.01, ***p-value < 0.001. (C) Principal component analysis (PCA) plot of RNA-seq from HDFn cells infected with lentivirus encoding ΔNp73β or empty vector control in combination with KLF4 and ΔNp63α. Cells were grown for 6 days and RNA was harvested for RNA-seq analysis. The percentage of variance contributed by each PC is listed in parentheses. (D and E) Tables listing the enriched Genome Ontology (GO) categories and pathways among the top 250 genes contributing to PC1 from (C). (F) Heatmap with the expression of a set of 44 genes that underlie the enrichment of GO categories from (D). Genes are annotated based on known roles in iKC-related processes (gray box) and the presence of a p63/p73 ChIP-seq peak within 50 kb of its TSS in multiple basal cell types (brown box). See also S5 and S6 Figs and S2–S9 Tables.

