
Fig 2. Forest plot of infection rates of S. japonicum in sentinel mice.
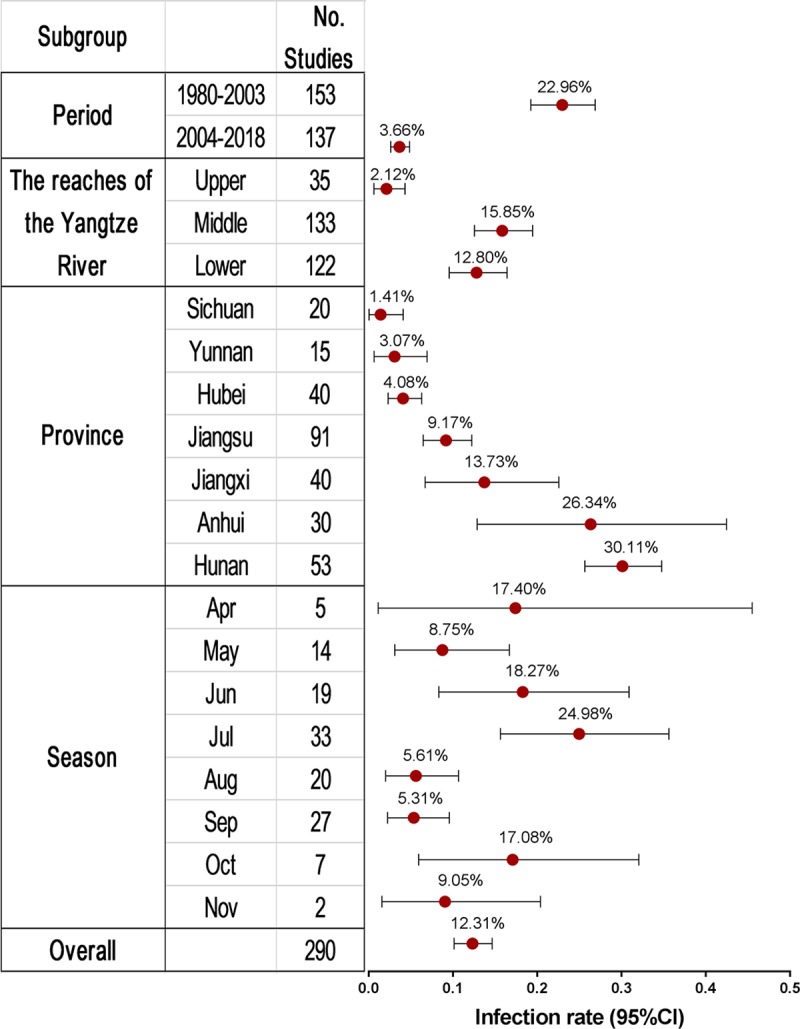
Red circles indicate infection rate estimated by random effects meta-analysis and whisker bars indicate the 95% CI. Results are shown for all included studies (bottom line, n = 290), and for subgroups according to periods, river reaches, provinces (excluding Zhejiang due to one study only) or seasons (for studies with the time of month specified).