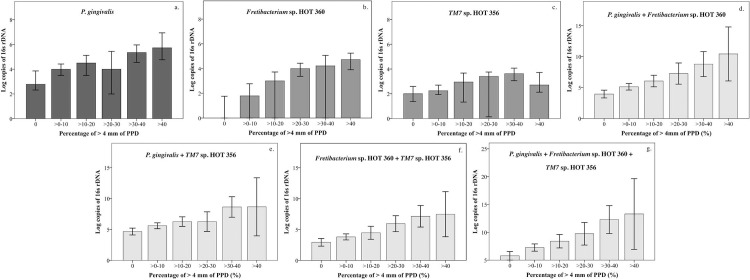
Fig 2. Bar graphs of bacterial loads and percentage of ≥4 mm groups.
The abundance of ≥ 4 mm PPD, as log of rDNA (y-axis), were evaluated with respect to ranges showing 10 percent (x-axis). For non-parametric data, graphs are shown using mean and 95% confident interval of the mean (a to c). For non-parametric data, graphs are shown using median and 95% confident interval of the median (d to g). Significant differences were observed between the groups; data are demonstrated in S1 Table. The abundance of Fretibacterium sp. HOT 360 (b) and combination of bacterial groups with Fretibacterium sp. HOT 360 (d, f, and g) increased with increasing percentage of ≥ 4 mm PPD.

