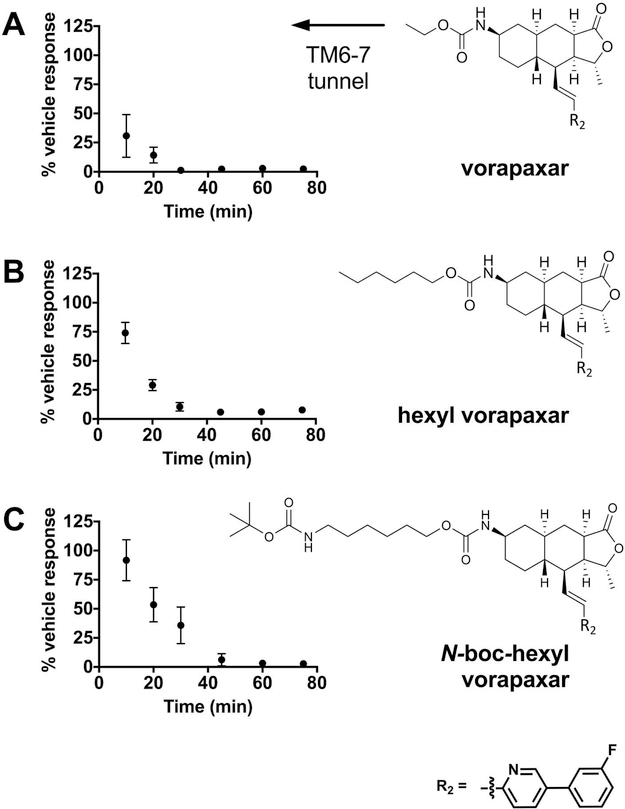
Figure 5.
Kinetics of PAR1 inhibition by vorapaxar derivatives. Time course of inhibition of the calcium flux response of Rati fibroblasts stably expressing human PAR1 by (A) vorapaxar, (B) hexyl vorapaxar, and (C) N-boc-hexyl vorapaxar. After incubation with 1 μM vorapaxar derivatives for the indicated time, cells were stimulated with 3 μM agonist peptide SFLLRN. The response is expressed as the percent obtained after incubation with vehicle alone in the absence of an inhibitor. Data are representative of three independent experiments (see also Figure S10), and each data point represents the mean ± the standard deviation (error bars) of three to six individual 96-well plates. The pooled data from all experiments were subjected to curve fitting (Table 1). At the right are chemical structures of vorapaxar derivatives. An increasing alkyl chain length and bulk predicted to extend through the TM6–TM7 exit tunnel is indicated by the arrow.

