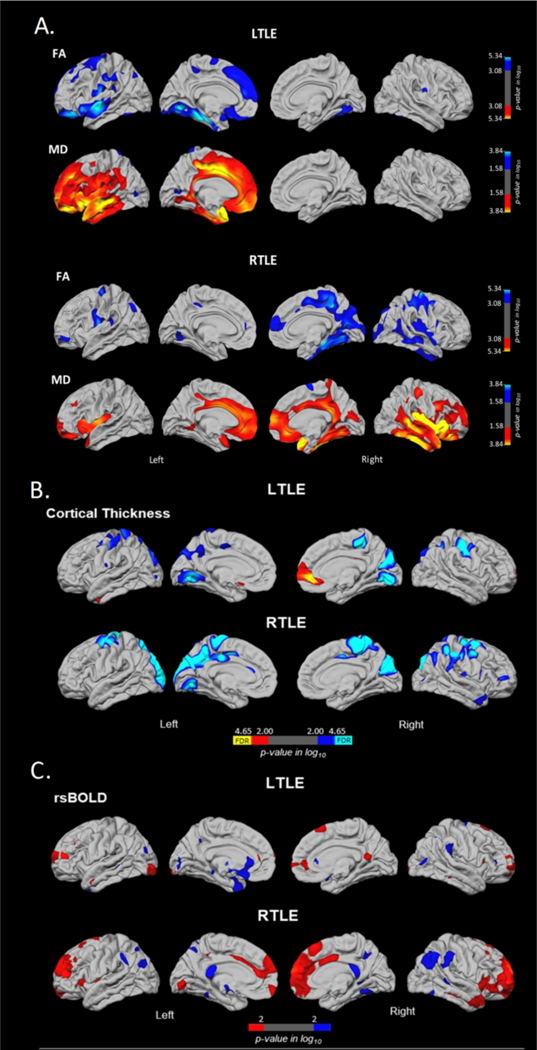
Figure 2.

Surface-based mapping of SWM diffusion (Fig. 2A), cortical thickness (Fig. 2B), and rsBOLD magnitude (Fig. 2C) differences in patients with LTLE and RTLE relative to controls. Blue and cyan represent regions where patients showed lower values relative to controls, whereas red and yellow represent regions where patients showed greater values relative to controls. A: Correcting for multiple comparisons, PFDR < 05. B: Blue and red represent group differences with a liberal threshold of p < .01, whereas cyan and yellow represent the regions that are survived after FDR-correction, PFDR < .05. C: Blue and red represent group differences with a liberal threshold of p < .01.
