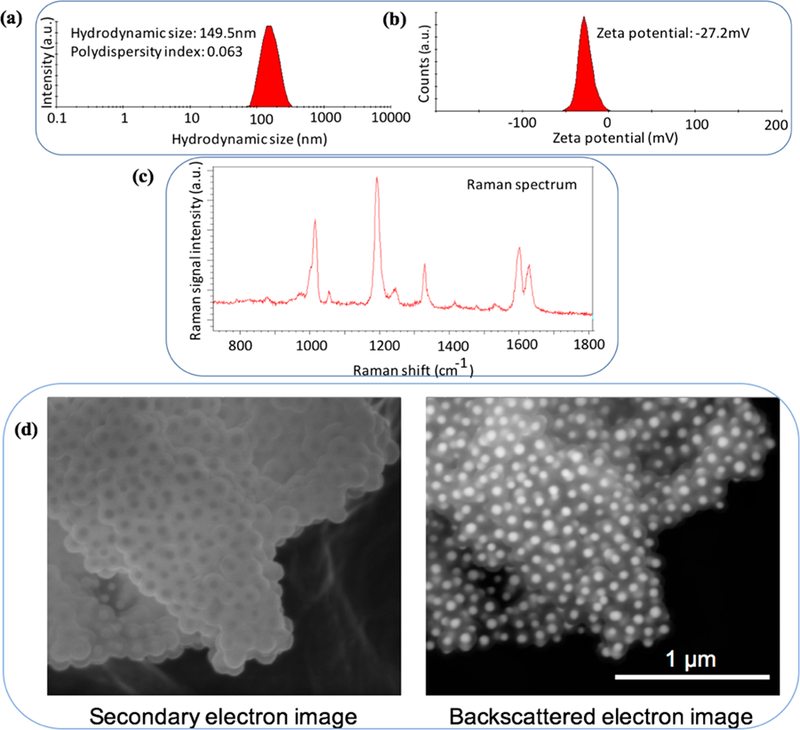
Figure 2.

(a and b) Hydrodynamic size distribution and zeta potential measurements of the PEG coated nanoparticles, showing an average size of ~150 nm (PDI: 0.06) and charge of ~−27 mV. The volume and number percentage diagrams are shown in Figure S3. The dynamic light scattering (DLS) measurements were performed in D5W solution. (c) Raman spectrum of the PEG coated nanoparticles. (d) Secondary and backscattered scanning electronic microscopy (SEM) images showing the uniform core?shell structure of silica coated gold nanoparticles. Stable and uniform silica layer ensured tight proximity of Raman reporter molecules to the surface of gold nanoparticles for surface plasmon resonance. Gold cores can be seen with darker and brighter contrasts in secondary and backscattering images, respectively.
