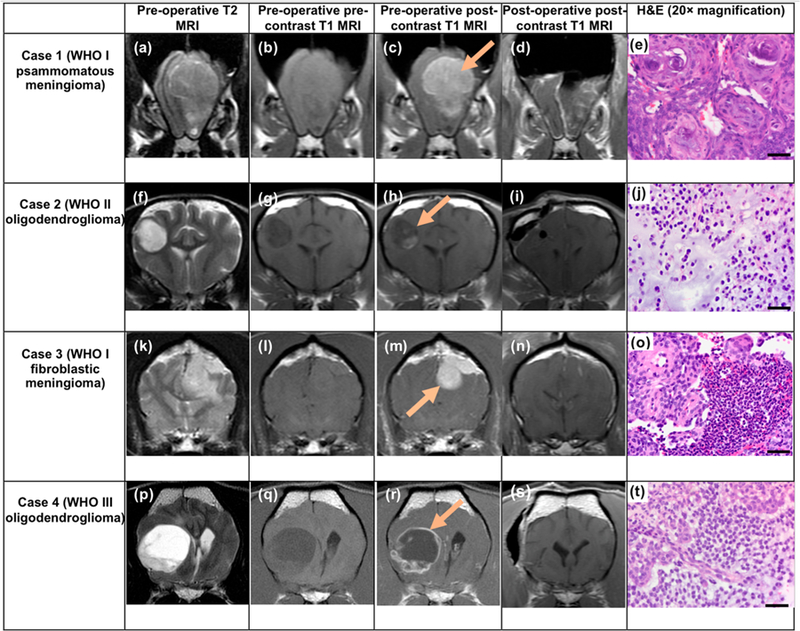
Figure 3.

Panel shows MR imaging for all four cases consisting of three preoperative transverse MRI scans (T2-, precontrast T1-, and postcontrast T1-weighted), the postoperative transverse postcontrast T1-weighted (T1W) MRI, and representative histology (H&E) images. T1W MRI scans were acquired before and after administration of gadolinium contrast (also see Figure S6 and the 3D MRI Supplementary Videos). The difference between the pre- and postcontrast T1W MRI scans (the bright area visible after administration of contrast that was not visible prior to contrast administration) indicates the contrast-enhancing tumor that contained hypervascularity or breakdown of the blood?brain barrier. Arrows in preoperative postcontrast T1W images indicate brain tumor areas in each case. T2 hyperintensity involving brain parenchyma beyond the margins of the mass likely represent vasogenic edema (high water content; panels k and p). Histology of the H&E stained tissue sections obtained from the surgery shows characteristics of psammomatous and fibroblastic meningiomas in Cases 1 and 3, respectively, and grade II and III oligodendroglioma in Cases 2 and 4, respectively. H&E = hematoxylin and eosin, MRI = magnetic resonance imaging, WHO = World Health Organization. H&E scale bars = 50 μm.
