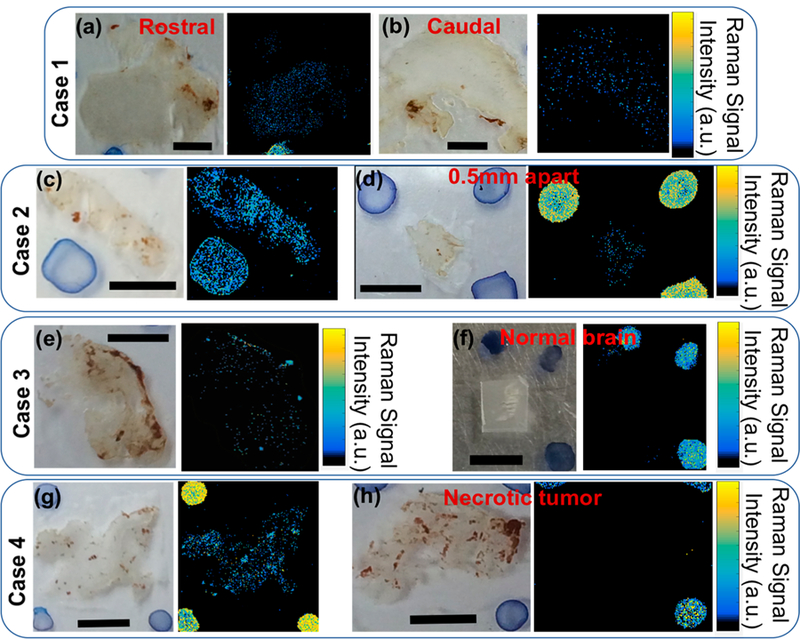
Figure 4.

White light and the counterpart Raman images of the tumor tissue sections (100 μm thick) resected from Cases 1, 2, 3, and 4, respectively. Sensitivity of the Raman microscopy helped detect traces of GNPs embedded in these tissue sections accurately and generate 2D maps of GNP distribution in tissues (also see Figures S7–S10). Comparing the images obtained from each case shows that GNPs had a heterogeneous distribution through the tumors. (a and b) Representative images obtained from caudal and rostral regions of the psamommatous meningioma in Case 1. (c and d) Images from oligodendroglioma tumor sections, where section (d) was cut at 0.5 mm from section (c). (e) Image of the fibroblastic meningioma tumor section in comparison with an area of normal brain (f) surrounding the resected tumor. This latter case supports that GNPs extravasated into the tumor only, with no detectable uptake in normal brain tissues. Finally, (g and h) Representative images generated from a tissue section cut from the margins of the tumor and central necrotic part. Blue spots in white light images are different mixtures of GNPs and Trypan Blue, used as fiducials for image reconstruction and accurate orientation adjustments. Scale bars in all images = 3 mm.
