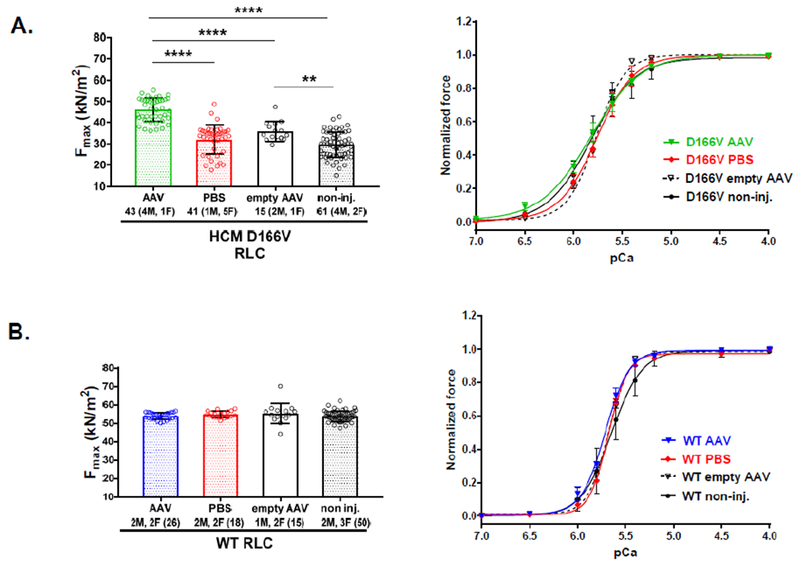
Figure 6.

Contractile function in skinned papillary muscle fibers from AAV-S15D-RLC, PBS and non-injected D166V (A) and WT (B) mice. Left panels show maximal tension at saturating (pCa 4) calcium concentrations per cross-section of muscle strip in kN/m2. Right panels show the force-pCa relationship in D166V (A) and WT (B) mice. Values are means ± SD (standard deviation) for n = # fibers. **P<0.01 and ****P<0.0001, calculated by one-way ANOVA with Tukey’s multiple comparison test. Note the improvement in steady-state force in AAV-S15D-RLC injected D166V mice compared with controls (PBS, AAV-empty and non-injected).
