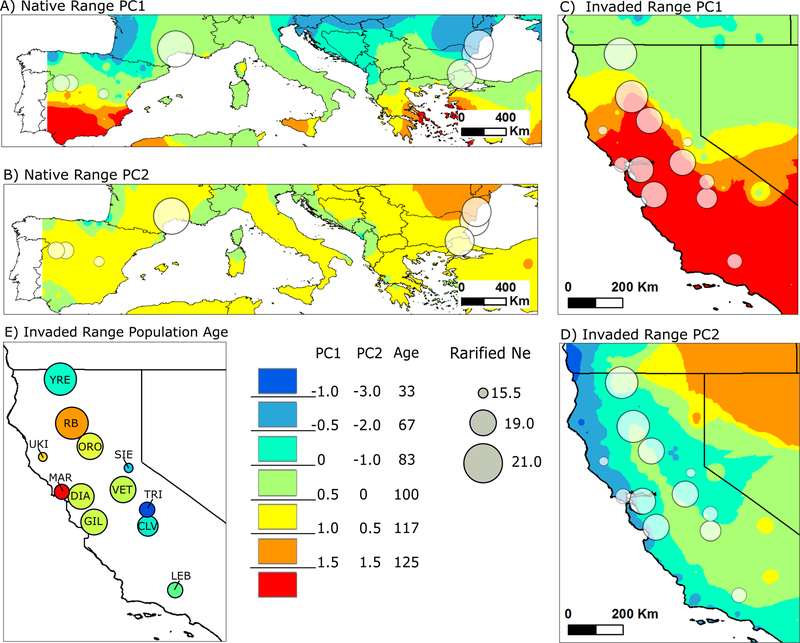
Fig 1.
The distribution of rarefied effective population size (Ne), climatic principal component (PC) gradients, and population age (in years) across C. solstitialis populations in Eurasia and California. In all panels, circles indicate sampled populations with a diameter proportional to Ne. PC1 is positively correlated with annual temperature and temperature of the driest quarter and negatively correlated with seasonal differences in total radiation in the native (A) and invaded (C) ranges. PC2 is positively correlated with seasonal differences in temperature and negatively correlated with annual precipitation and seasonal differences in precipitation in the native (B) and invaded (D) ranges. In the California invasion, population age (E) reflects a history of expansion beginning in the San Francisco Bay area and expanding first to the North and then to the South and East of the state. Abbreviations in (E) correspond to populations in Table S1.

