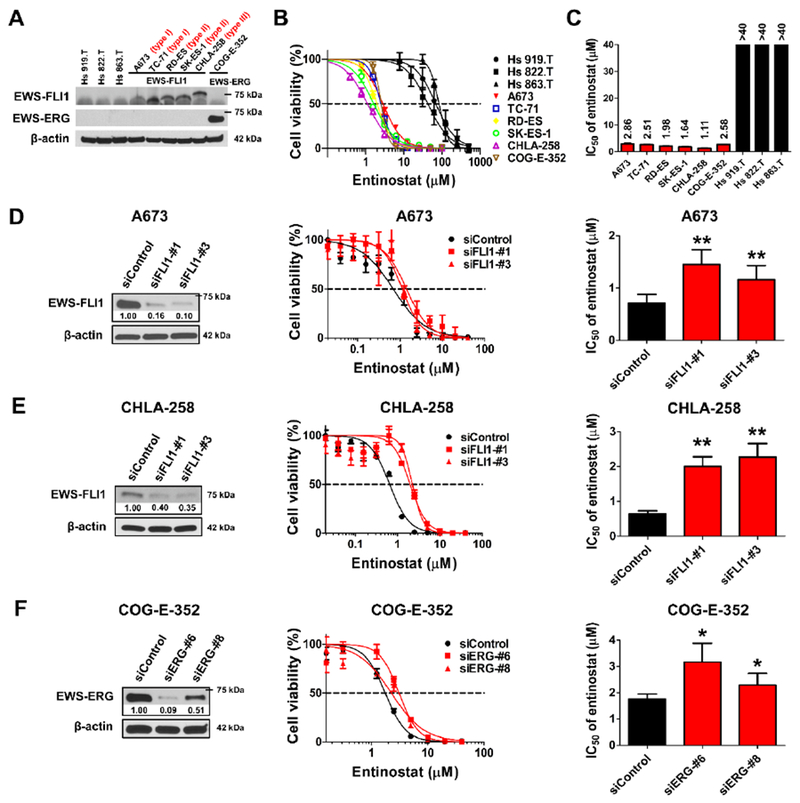
Figure 1. Entinostat is preferentially toxic to EWS-rearranged ES cells and EWS-FLI1 and EWS-ERG confer sensitivity to the treatment of entinostat.

A, Western blot analysis of the expression of EWS-FLI1 and EWS-ERG fusion proteins in non-EWS-rearranged benign cells (Hs 919.T, Hs 822.T and Hs 863.T) and EWS-rearranged ES cells (A673, TC-71, RD-ES, SK-ES-1, CHLA-258 and COG-E-352). Three molecular subtypes (type I, II and III) of EWS-FLI1 fusion transcript are labeled. B, Dose-response curves of entinostat across non-EWS-rearranged benign cells (black) and EWS-rearranged ES cells (red, blue, yellow, green, purple and brown). Cell viability is normalized to the DMSO-treated controls and shown as mean ± SD of two to five independent experiments, each performed in triplicate. C, IC50 values of entinostat across non-EWS-rearranged benign cells (black) and EWS-rearranged ES cells (red). Data are mean ± SEM and detailed in Supplementary Table S5. Mean values are indicated above the bars. D, Representative Western blot image shows the downregulated expression of EWS-FLI1 in A673 cells 72 h post siRNA transfection. Cell viability was assessed in A673 cells treated by siControl, siFLI1-#1 or siFLI1-#3 for 24 h then followed by the incubation of entinostat for 72 h, and was presented as mean ± SD of two independent experiments (n = 3). IC50 values of entinostat in A673 cells were expressed as mean ± SEM. E, Representative Western blot image shows the downregulated expression of EWS-FLI1 in CHLA-258 cells 72 h post siRNA transfection. Cell viability was assessed in CHLA-258 cells treated by siControl, siFLI1-#1 or siFLI1 -#3 for 24 h then followed by the incubation of entinostat for 72 h, and was presented as mean ± SD of two independent experiments (n = 3). IC50 values of entinostat in CHLA-258 cells were expressed as mean ± SEM. F, Representative Western blot image shows the downregulated expression of EWS-ERG in COG-E-352 cells 72 h post siRNA transfection. Cell viability was assessed in COG-E-352 cells treated by siControl, siERG-#6 or siERG-#8 for 24 h then followed by the incubation of entinostat for 72 h, and was presented as mean ± SD of two independent experiments (n = 3). IC50 values of entinostat in COG-E-352 cells were expressed as mean ± SEM. β-actin served as a loading control. The relative intensities of protein bands are shown under the immunoblots after normalization for the levels of β-actin. * p < 0.05, ** p < 0.01 vs. siControl by Student’s t test.
