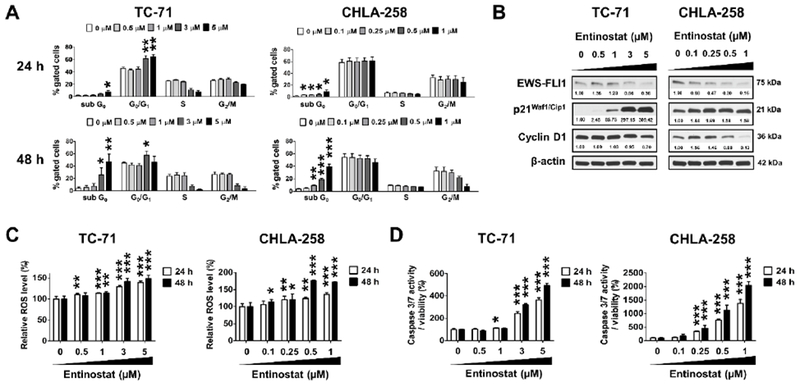
Figure 2. Entinostat causes cell cycle arrest, increases ROS levels and induces apoptosis in ES cells.

A, Cell cycle analysis in TC-71 and CHLA-258 cells treated with entinostat at the indicated concentrations for 24 h and 48 h, respectively. B, Western blot images showing the down-regulation of EWS-FLI1 and cyclin D1 expression, as well as the up-regulation of p21waf1/Cip1 expression 24 hours post entinostat treatment in TC-71 and CHLA-258 cells. β-actin served as a loading control. The relative intensities of protein bands are shown under the immunoblots after normalization for the levels of β-actin. C, ROS levels in TC-71 and CHLA-258 cells following the treatment of entinostat at the indicated concentrations for 24 h and 48 h, respectively. D, Caspase 3/7 activities of TC-71 and CHLA-258 cells treated with entinostat at the indicated concentrations for 24 h and 48 h, respectively. Data are presented as the mean ± SD (n = 3 – 6). * p < 0.05, ** p < 0.01, ***p < 0.001 vs. 0 μM at respective cell phase or time point by Student’s t test. H, hours.
