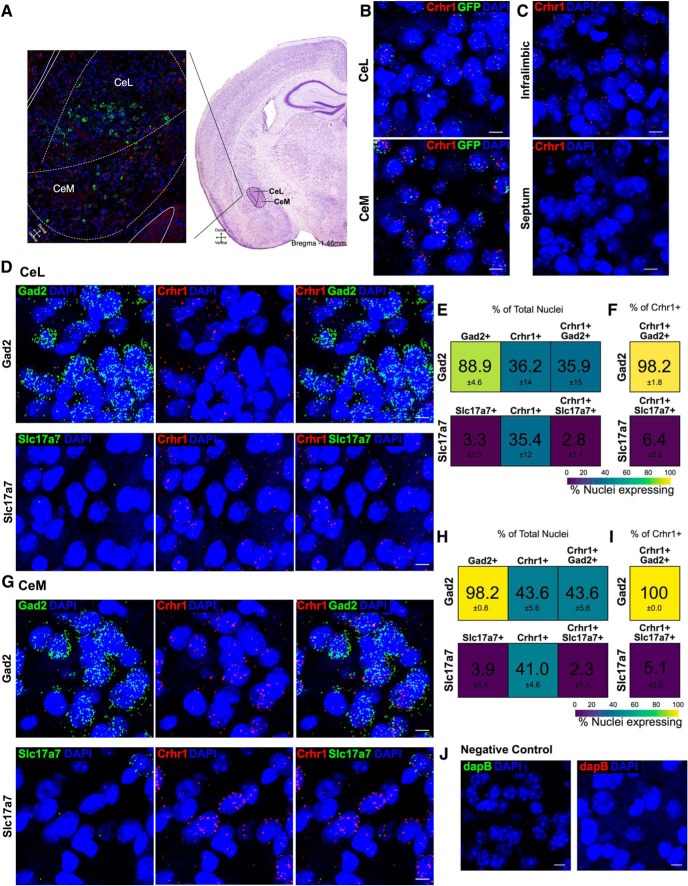
Figure 2.
Co-expression of Gad2 or Slc17a7 RNA in Crhr1+ nuclei. A, Schematic of CeA, with CeL and CeM indicated, is overlaid on tiled image of the CeA in which Crh (green), Crhr1 (red), and DAPI (blue) are shown. Image acquisition position of the CeA (approximately bregma –1.46 mm) is shown on Nissl stained image (Franklin and Paxinos, 2008) to indicate the region of interest. B, Representative images indicate the co-expression of GFP and Crhr1 in the GFP:CRF1 mice in CeL (58%; n = 8 images) and CeM (86%; n = 7 images; Crhr1 = red, GFP = green, DAPI = blue). Scale bar = 10 μm. C, Crhr1 probe specificity was validated in the septum of wild-type mice, a region of low Crhr1/GFP expression (n = 2 images). Negligible expression was observed in the septum as compared to the infralimbic prefrontal cortex in the same slice (Crhr1 = red, DAPI = blue). Scale bar = 10 μm. D, Representative images for Gad2 (upper; green = Gad2, red = Crhr1, blue = DAPI; n = 5 images) and Slc17a7 (lower; green = Slc17a7, red = Crhr1, blue = DAPI; n = 7 images) in the CeL. Scale bar = 10 μm. E, Heat map represents the percentage of nuclei expressing (from left to right) RNA of interest, Crhr1, and co-expression in the total nuclei counted in the CeL. F, Heat map represents the percentage of nuclei co-expressing in the Crhr1+ population of nuclei in the CeL. Color scale from 100% (yellow) to 0% (purple). G, Representative images for Gad2 (upper; green = Gad2, red = Crhr1, blue = DAPI; n = 5 images) and Slc17a7 (lower; green = Slc17a7, red = Crhr1, blue = DAPI; n = 7 images) in the CeM. Scale bar = 10 µm. H, Heat map represents the percentage of nuclei expressing (from left to right) RNA of interest, Crhr1, and co-expression in the total nuclei counted in the CeM. I, Heat map represents the percentage of nuclei co-expressing in the Crhr1+ population of nuclei in the CeM. Color scale from 100% (yellow) to 0% (purple). Data are shown as mean ± SEM. J, Representative negative control images for the bacterial probe DapB in the CeM indicate negligible fluorescence intensity for both channels shown (DapB = red, DapB = green, DAPI = blue). Scale bar = 10 μm. Figure Contributions: S. A. Wolfe and S. R. D’Ambrosio performed the experiments. S. A. Wolfe analyzed the data.

