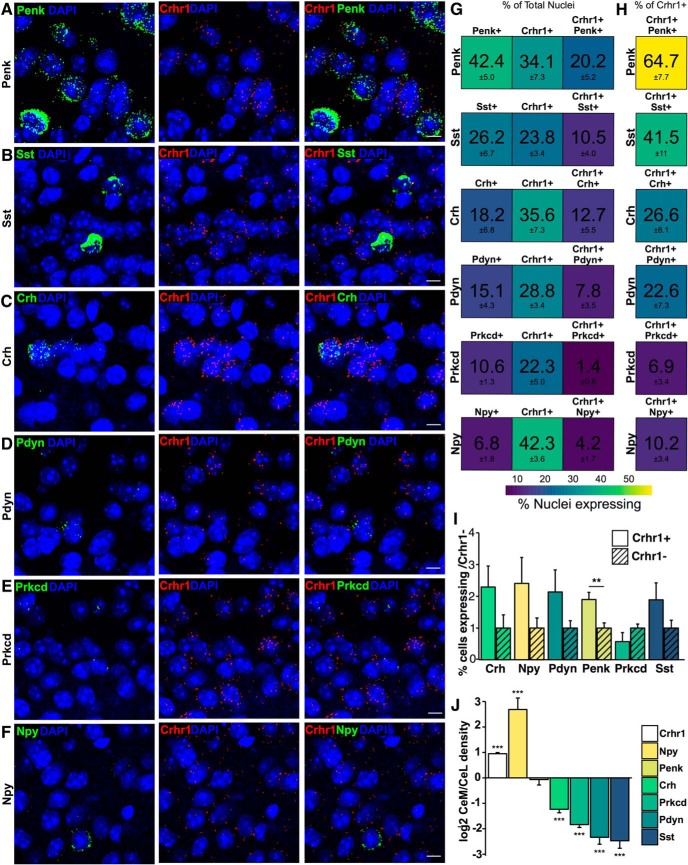
Figure 4.
Co-expression of RNA of interest in Crhr1+ nuclei in the CeM. Representative images from top to bottom for (A) Penk (green = Penk, red = Crhr1, blue = DAPI; n = 11 images), (B) Sst (green = Sst, red = Crhr1, blue = DAPI; n = 10 images), (C) Crh (green = Crh, red = Crhr1, blue = DAPI; n = 11 images), (D) Pdyn (green = Pdyn, red = Crhr1, blue = DAPI; n = 8 images), (E) Prkcd (green = Prkcd, red = Crhr1, blue = DAPI; n = 6 images), and (F) Npy (green = Npy, red = Crhr1, blue = DAPI; n = 8 images) in the CeM. G, Heat map represents the percentage of nuclei expressing (from left to right) RNA of interest, Crhr1, and co-expression in the total nuclei counted in the CeM. H, Heat map represents the percentage of nuclei co-expressing in the Crhr1+ population of nuclei in the CeM. Color scale from 60% (yellow) to 0% (purple). I, Quantification of the difference between the percentage nuclei expressing RNA of interest [Crh, Prkcd, Pdyn, Npy, Penk (p = 0.004), and Sst] in Crhr1+ nuclei versus Crhr1– nuclei in the CeM (mean ± SEM; **p < 0.01 unpaired t test). J, Bar graph showing the difference in log2 of the signal intensity between CeL and CeM of Crhr1 (n = 3079 nuclei), Npy (n = 90 nuclei), Penk (n = 468 nuclei), Crh (n = 273 nuclei), Prkcd (n = 276 nuclei), Pdyn (n = 141 nuclei), and Sst (n = 145 nuclei) in Crhr1+ nuclei (mean ± SEM; ***p < 0.001 unpaired t test from CeL). Figure Contributions: S. A. Wolfe performed the experiments and analyzed the data.

