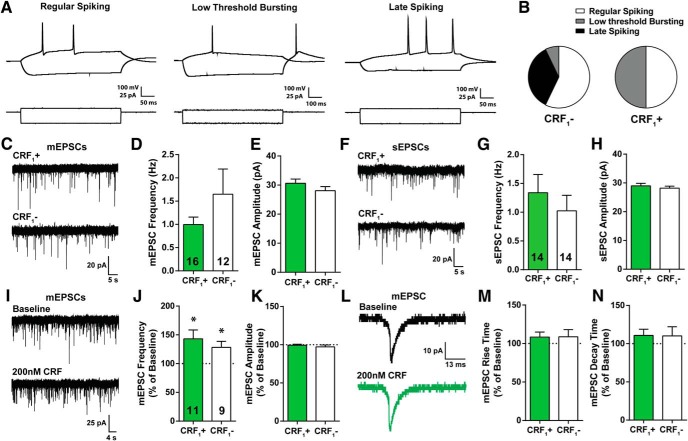
Figure 6.
Membrane properties and glutamatergic transmission of CRF1+ and CRF1– neurons in the CeA. A, Representative current-clamp recordings from three cell-types: regular spiking (left), low threshold bursting (middle) and late spiking (right) from a CeA neuron. B, Distribution of cell-types recorded from for CRF1– (n = 15) and CRF1+ (n = 16) CeA neurons. C, Representative traces of mEPSCs in CRF1+ (top) and CRF1– (bottom) CeA neurons. D, E, Frequency and amplitude of mEPSCs in CRF1+ (n = 16) and CRF1– (n = 12) CeA neurons. F, Representative traces of sEPSCs in CRF1+ (top) and CRF1– (bottom) CeA neurons. G, H, Frequency and amplitude of sEPSCs in CRF1+ (n = 14) and CRF1– (n = 14) CeA neurons. I, Representative traces of mEPCS during baseline (top) and 200 nM CRF application (bottom) from CRF1+ CeA neurons. J, K, CRF effects on frequency and amplitude of mEPSCs in CRF1+ (n = 11) and CRF1– (n = 9) CeA neurons, respectively. L, Average trace of mEPSC during baseline (black) and 200 nM CRF (green) application from a CRF1+ CeA neuron. M, N, CRF effects on rise and decay time of mEPSCs in CRF1+ and CRF1– CeA neurons, respectively (*p < 0.05 by one-sample t test). Data are shown as mean ± SEM. Figure Contributions: R. R. Patel performed the experiments and analyzed the data.

