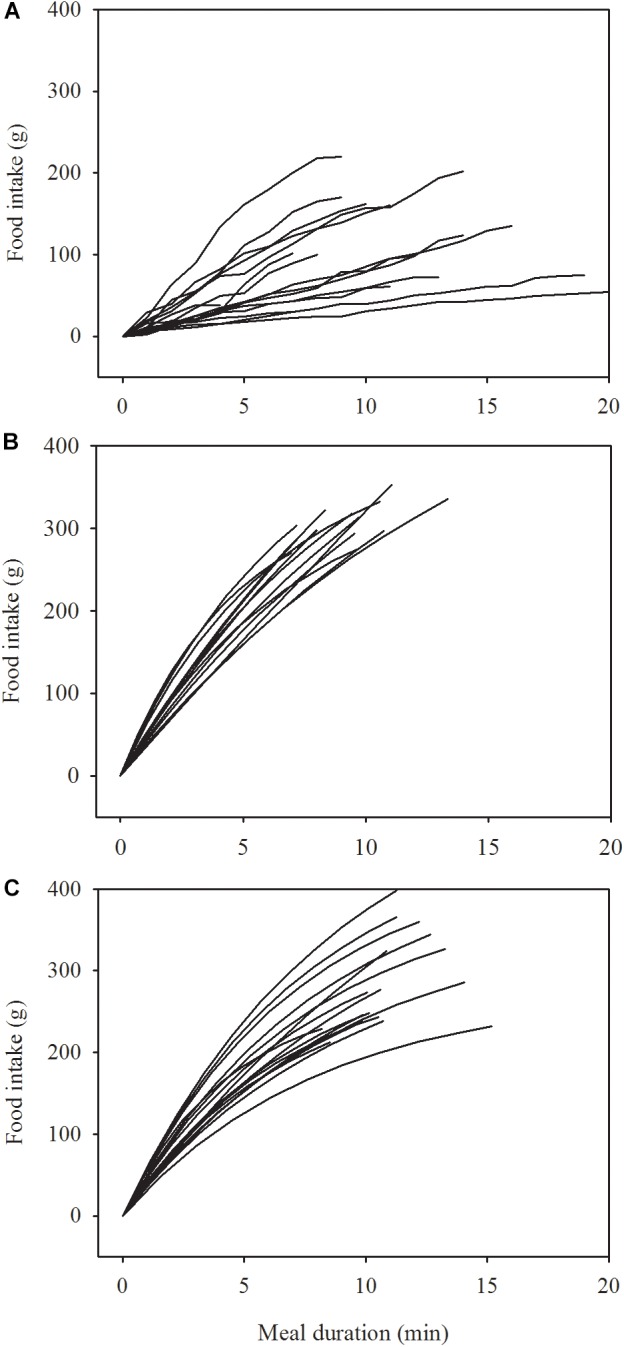
FIGURE 1.

Change in the rate of eating in 17 women at admission (A) and at remission (B) after treatment of anorexia nervosa and in 17 healthy women (C). Data in A are raw data collected at 1 min intervals. Data in B,C are modeled by a two-parameter asymptotic exponential curve, see text for details.
