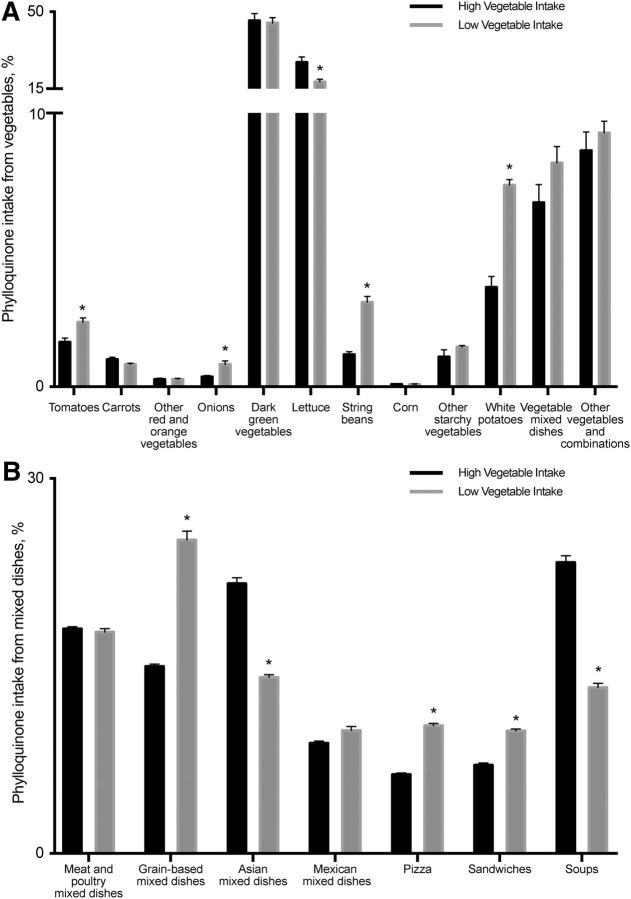
FIGURE 1.
Contribution (%) of vegetable (A) and mixed-dish (B) subgroups to dietary vitamin K intake in the diets of US adults (aged ≥20 y; high vegetable intake, n = 1117; low vegetable intake, n = 3133) in NHANES 2011–2012 by food group categories. Data are presented as means ± SEs. *Different from high vegetable intake, P < 0.01.

