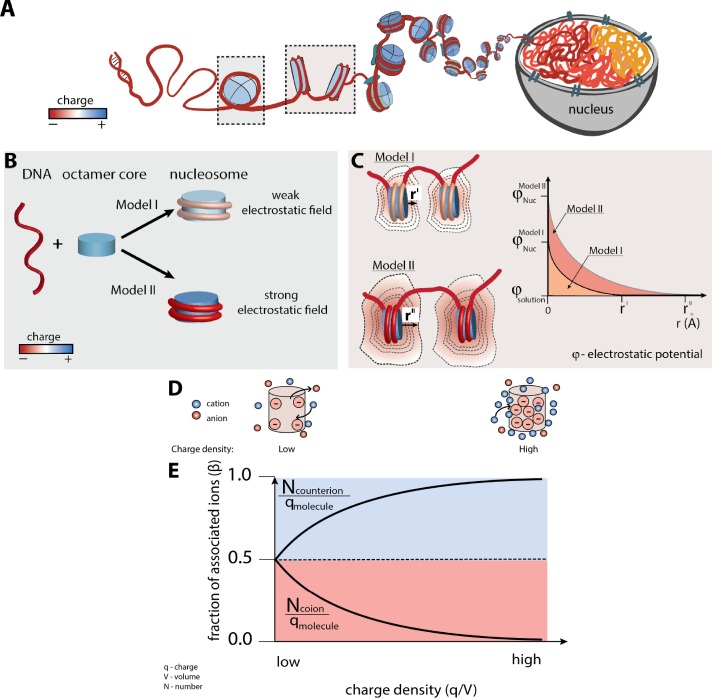
Figure 1. Nucleosome electrostatics: models and implications.
(A) Schematic representation of nucleosome formation and DNA compaction. (B) Models of nucleosome electrostatics. According to Model I, the electrostatic field around the nucleosome is weak due to compensatory electrostatic interactions between the DNA and the positively charged histone octamer. In Model II the electrostatic field remains strong, as has been proposed by theoretical and computational studies. (Schiessel, 2003; Materese et al., 2009; Elbahnsi et al., 2018) (C) Schematic representation of the effect of nucleosome electrostatics on their propensity to compact according to Models I and II. The distance for full screening of electrostatic repulsion is considerably less for Model I (top) than for Model II (bottom; rI vs. rII). (D) Schematic representation of an ion atmosphere around a low charge density (ρ) (left) and a high charge density molecule (right). (E) Fraction of associated counterions (e.g., cations around a negatively charged molecule) and coions (e.g., anions around a negatively charged molecule) within a molecule’s ion atmosphere as a function of the molecule’s charge density (assuming a uniform charge distribution for simplicity). The magnitude of the electrostatic field correlates with the charge density of the molecule: the higher the charge density, the larger magnitude of the electrostatic field and stronger counterion attraction, as depicted by the cartoons in part (D).

