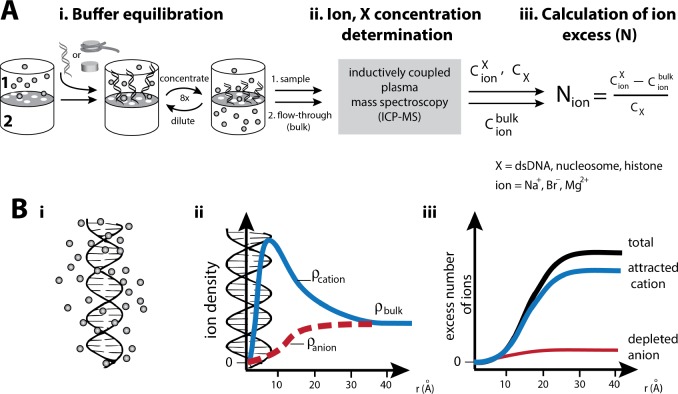
Figure 2. Experimental characterization of the ion atmosphere around macromolecules by ‘ion counting’.
(A) Schematic of an ‘ion counting’ experiment to quantify the composition of the ion atmosphere around dsDNA, nucleosomes, histones or the histone octamer (Bai et al., 2007; Gebala et al., 2015; Greenfeld and Herschlag, 2009). A detailed description of the ion counting method can be found in the Materials and methods section. Adapted from reference (Gebala et al., 2015). (B): i) Schematic representation of the cation excess surrounding a nucleic acid. ii) Schematic representation of ion density as a function of distance from a nucleic acid estimated by Poisson-Boltzmann (PB) theory; PB predictions adapted from (Giambaşu et al., 2014). Counterions and coions are radially distributed within the ion atmosphere around charged molecules. The highest density of counterions localizes near to the surface of the molecule, where the highest electrostatic potential resides; far from the molecule the density equals that of the bulk solution. Coions give the opposite behavior, with the lowest density near the molecule’s surface due to electrostatic repulsion. iii) Computationally, the number of ions associated (the excess number, (N) with the ion atmosphere is calculated by integrating the excess ion density around the nucleic acid (Equation 4 in Material and methods).

