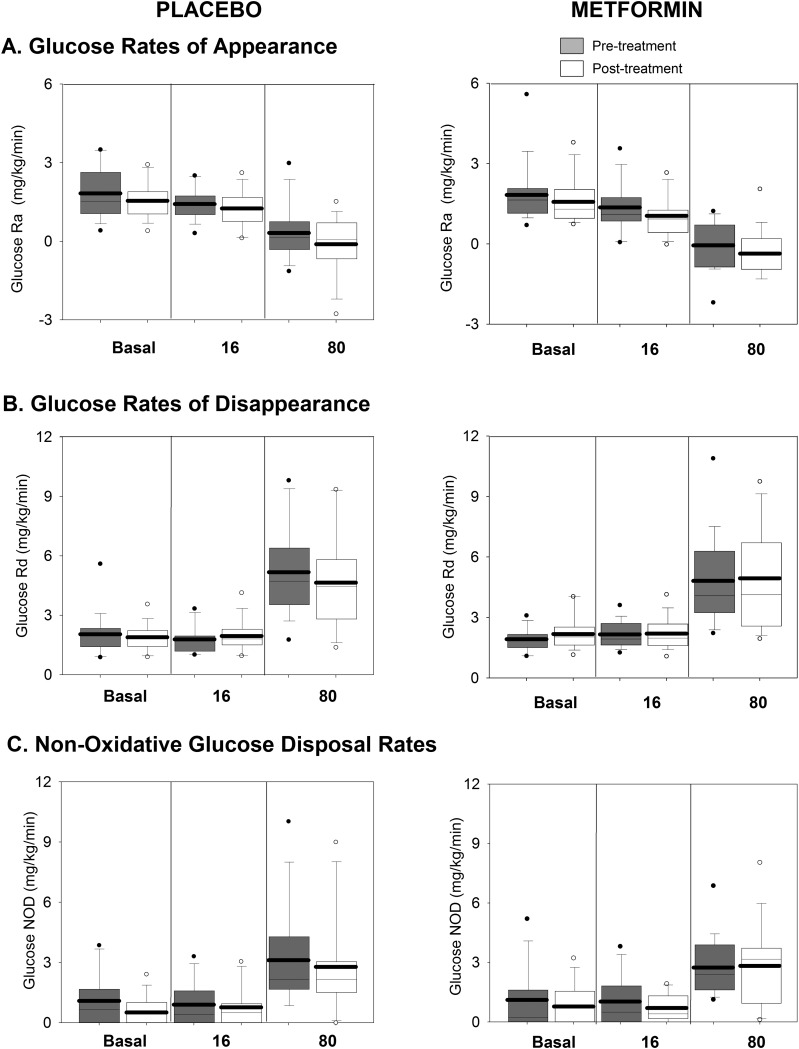
Figure 3.
Glucose-related measures during the clamp, before and after intervention. Rates of glucose Ra (A), glucose (B), and glucose nonoxidative disposal (NOD) (C) are shown. The placebo-treated groups are shown on the left, and the metformin-treated group is shown on the right, with pretreatment in gray and posttreatment in white. Data are shown from each phase of the clamp (basal, 16 mIU/m2/min, and 80 mIU/m2/min). Box plots are 25th to 75th percentile, with the group mean as the dark line and outliers shown as circles.

