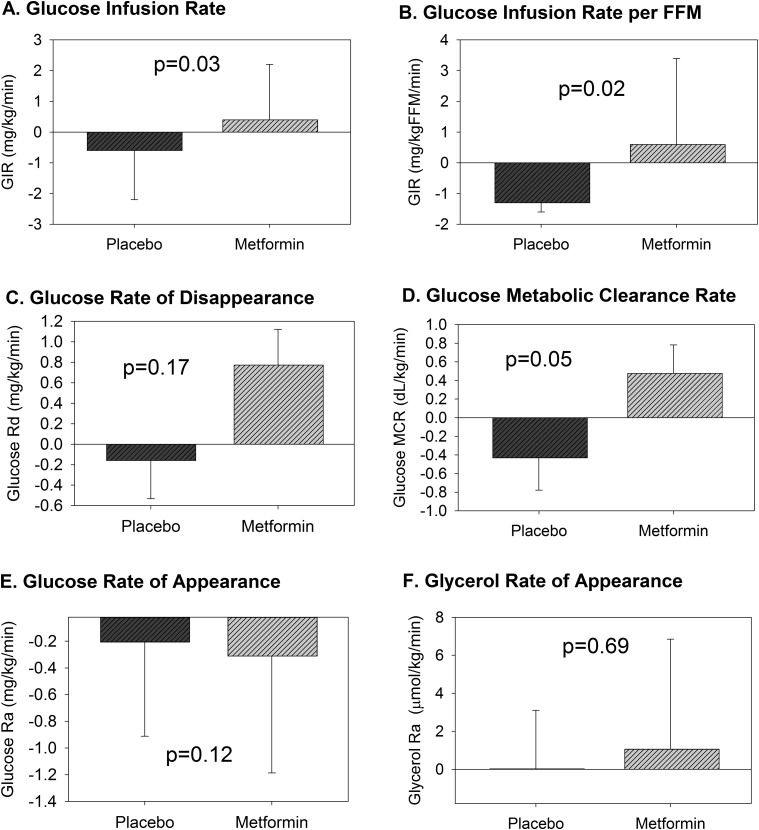
Figure 4.
Change in clamp measures of insulin sensitivity. The change in each measure of insulin sensitivity from baseline to 13 weeks for the placebo or metformin treatment group are shown above. GIR (A) and GIR per FFM (B) representing whole-body sensitivity were different between groups after treatment. Peripheral insulin sensitivity from the 80 mU/m2/min phase, represented as change in glucose Rd (C), was not different between groups, whereas glucose MCR (D), which controls for serum glucose, trended to be different. There was no difference in change in glucose Ra (E) during the 16 mU/m2/min phase, representing endogenous glucose production, nor glycerol Ra (F) during the 10 mU/m2/min phase, representing lipolysis. Data are means and standard errors of the means.

