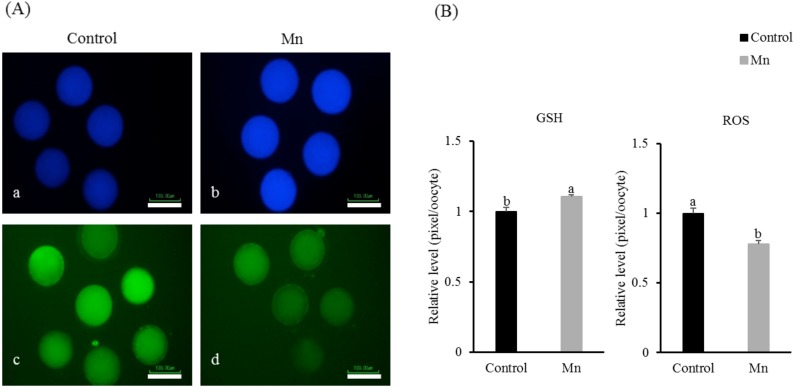
Fig. 2.
Epifluorescent photomicrographic images of in vitro matured porcine oocytes. (A) Matured oocytes are stained with CellTracker Blue (a–b) and 2’, 7’–dichlorodihydrofluorescein diacetate (H2DCFDA; c–d) to detect intracellular glutathione (GSH) and reactive oxygen species (ROS) levels, respectively. In vitro matured oocytes derived from the control (a and c) and 6 ng/ml of Mn treated group (b and d). (B) Effects of Mn on the intracellular levels of GSH and ROS during IVM of in vitro matured porcine oocytes. Bars with different letters (a and b) represent significant differences within the respective endpoint (GSH or ROS; (P < 0.05)). Scale bars indicate 100 µm. Error bars show the standard error of the mean.

