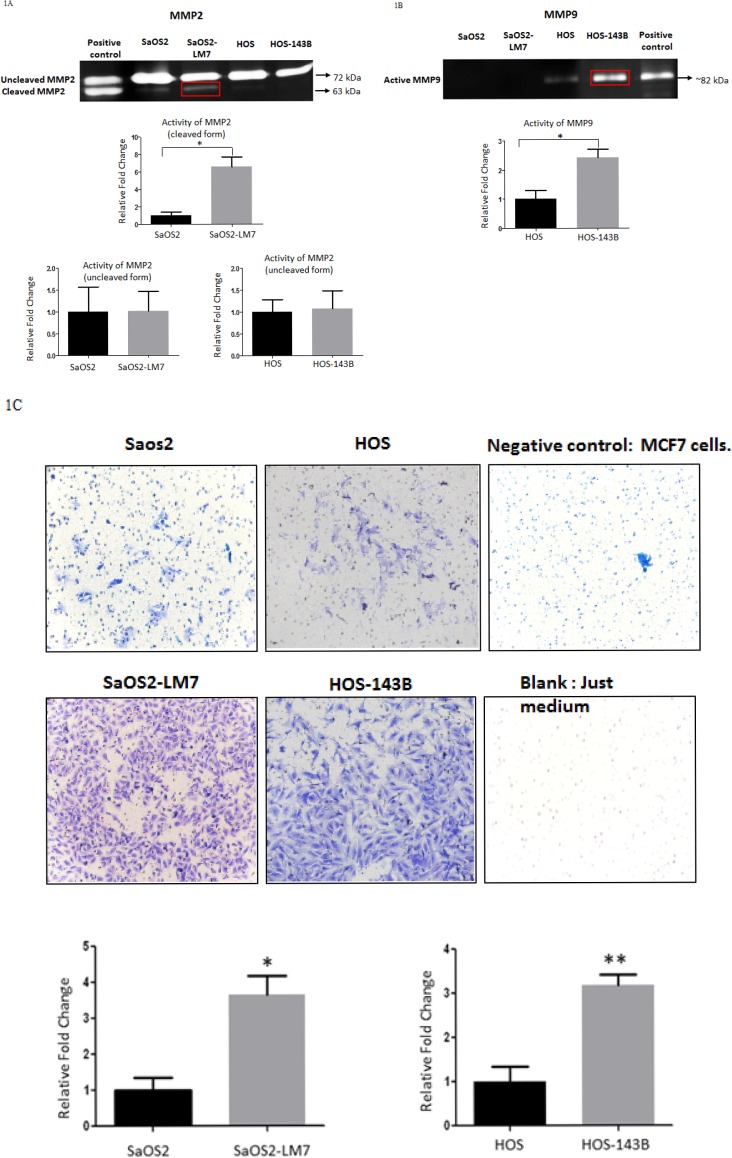
Figure 1. Comparison of potential aggressive/metastatic phenotype of OS cell lines in vitro.
Gelatin zymography was used as a measure of the activity for A. MMP2 and B. MMP9 in concentrated conditioned media from cells grown in serum free media for 24 h. No significant difference was observed in the activity of the un-cleaved form of MMP2 in either pair of cell lines. However, there was a significantly greater activity observed in the cleaved MMP2 in the SaOS2-LM7 cell line compared to SaOS2. Data is representative data of 6 or more experiments; *p<0.05. Although HOS/HOS-143B did not show any activity for cleaved MMP2, there was significantly greater MMP9 activity in the HOS-143B cells compared to HOS cells. Data is representative data of 6 or more experiments; ***p < 0.001. The SaOS2/SaOS2-LM7 pair did not exhibit any MMP9 activity. C. Figure shows comparison of the invasive potential of the two paired OS cell lines (SaOS2/SaOS2-LM7 and HOS/HOS-143B using Transwell invasion assay through Matrigel. We observed significantly higher numbers of invaded cells for SaOS2-LM7 and HOS-143B compared to SaOS2 and HOS cells, respectively. Each group of data is representative of 3 or more experiments. *p < 0.05; **p < 0.01. The upper panels show representative images of the invaded cells.

