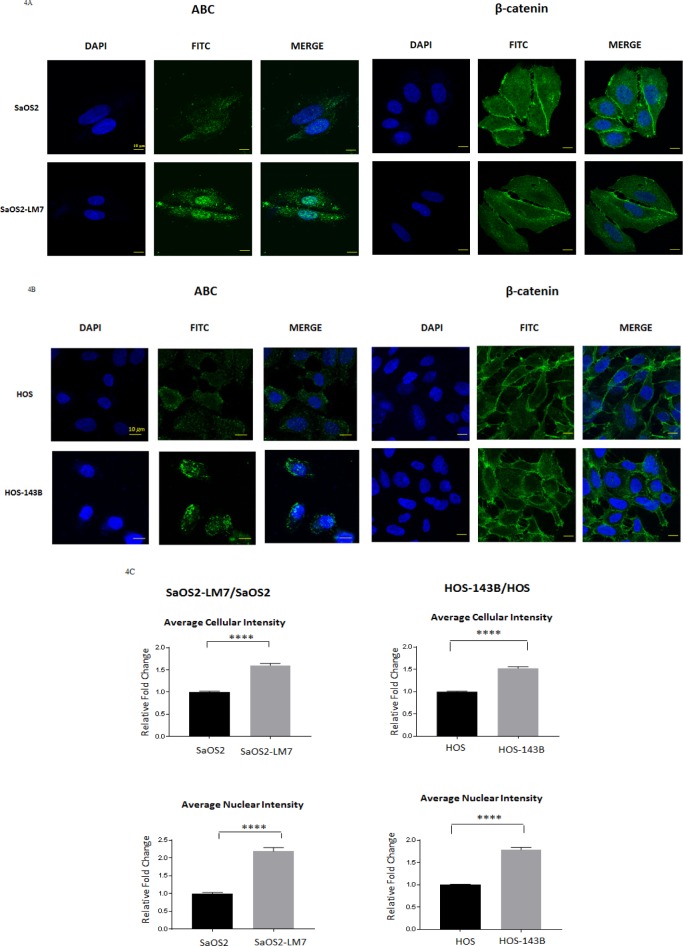
Figure 4. Cellular localization and quantification of ABC fluorescence intensity in OS cell lines.
Immunofluorescence analysis for ABC and β-Catenin in A. SaOS2 and SaOS2-LM7 cells and b. HOS and HOS-143B cells. Figure shows higher levels of ABC in SaOS2-LM7 and HOS-143B cells that is predominantly nuclear compared to SaOS2 and HOS, respectively. There was no difference observed in the cellular localization of β-Catenin in the SaOS2/SaOS2-LM7 or HOS/HOS-143B cell pairs. IF images are representative of 6 or more experiments. C. Quantification of total cellular and nuclear levels of ABC in SaOS2/SaOS2-LM7 and HOS/HOS-143B cells (from IF images (10X) using MetaXpress software). Results show that there were significantly higher levels of ABC in the cytoplasm, and more importantly in the nucleus, of the SaOS2-LM7 and HOS-143B cells compared to their parental lines. Each group of data is representative of 6 or more experiments. ***p < 0.0001.

