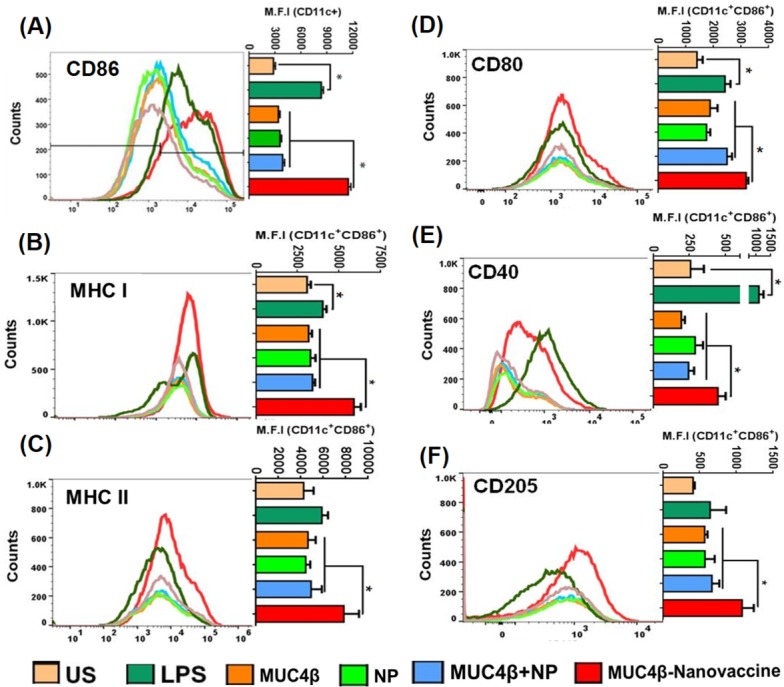
Figure 2. MUC4β-nanovaccine activates DCs and induces expression of MHC II and co-stimulatory molecules.

Flow cytometry analysis of in vitro antigen-pulsed DCs shows that MUC4β-nanovaccine activates DCs robustly as compared to other treatment groups. A. MUC4β-nanovaccine significantly upregulates CD86 expression in the CD11c+ population as analyzed by comparing the Mean Fluorescence Intensity (MFI) among all the treatment groups. LPS served as a positive control in the experiment, and unstimulated (US) DCs as negative control. B-F. Analysis of costimulatory and activation markers in CD11c+CD86+ cells. MUC4β-nanovaccine treatment upregulated the expression levels of MHC I (B), MHC II (C), CD80 (D), CD40 (E), and CD205 (F) after 48 h of stimulation using MUC4β protein (3 μg/mL), NP (100 μg/mL), or MUC4β+NP and MUC4β-nanovaccine (100 μg/mL). The fluorophore-conjugated antibodies were used at a 1:300 dilution except anti-CD40 antibody, which was used at a 1:200 dilution. The representative histograms for each surface marker have been presented with adjacent bar graphs showing the post-treatment MFI change. Each histogram plot represents a single experiment and the MFI plots summarize all experiments (n = 3). One-way ANOVA was used for data comparison for each group and pair wise comparison was performed using Student's paired t-test. The statistical significance was set at p < 0.001.
