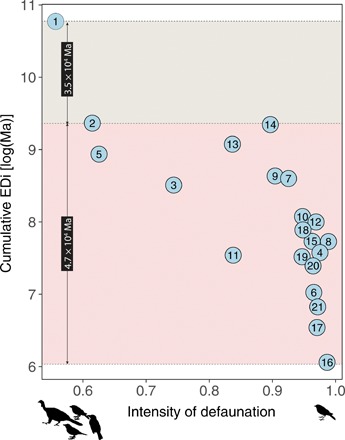
Fig. 3. The EDi promoted by bird-mediated seed dispersal decreases sharply along a gradient of defaunation.

The cumulative EDi that a fragment carries corresponds to the sum of the EDi values of all interactions recorded in that fragment, here, the sum of the EDi values of all seed dispersal interactions by birds. The most pristine area is the top-left circle (1), which is the largest remnant of the Atlantic Forest and also the least defaunated fragment, used here as the baseline to illustrate the position of a “pristine” forest. The top-shaded facet of the graph represents the amount of cumulative EDi lost from the most pristine area to the second least disturbed fragment (2), while the bottom-shaded facet indicates the amount of cumulative EDi lost from the pristine area to the most disturbed fragment (16). Areas (identified by numbers within circles) are presented in a decreasing order of fragment area, according to a detailed description of each site in table S1. Larger fragments tend to be less disturbed, therefore harboring forests closer to the most pristine, best-preserved extreme.
