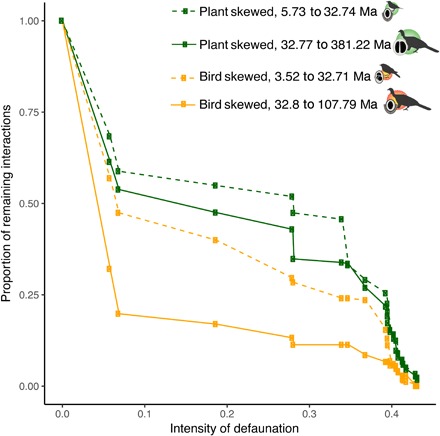
Fig. 4. Defaunation leads to an impoverishment of seed dispersal interactions and their associated asymmetries in the EDi.

The proportion of interactions remaining in each fragment significantly decreases with defaunation, and this pattern is maintained when controlling for fragment area (fig. S5). The four types of bird–seed dispersal interaction asymmetries showed a similar trend in losing ED, but the loss was faster for bird-skewed interactions while plant-skewed interactions persisted longer in the gradient of defaunation. The 50th percentile was used as the threshold to define low and high EDi values. The defaunation index is scaled according to the lowest value among all fragments, which corresponds to the largest area and less defaunated remnant of the Atlantic Forest, used here as a baseline value to illustrate the position of a pristine forest. Continuous lines indicate high ED; dashed lines indicate low ED. The four types of asymmetry correspond to different combinations of EDi, as follows: Plant skewed, low ED (minimum EDi, 5.73 Ma; maximum EDi, 32.74 Ma); plant skewed, high ED (32.77 to 381.22 Ma); bird skewed, low ED (3.52 to 32.71 Ma); bird skewed, high ED (32.8 to 107.79 Ma).
