Fig. 3.
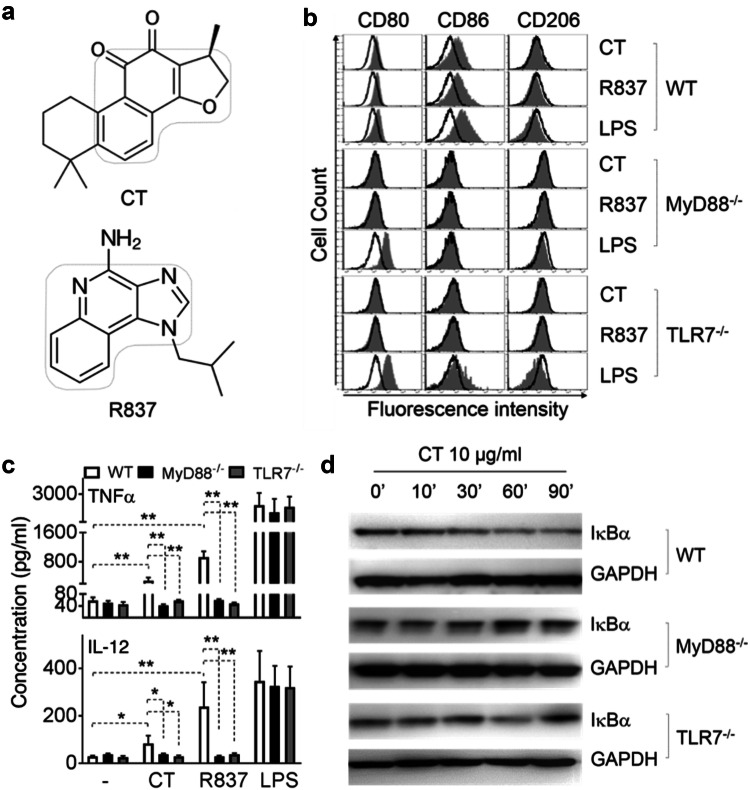
Effect of CT on wild-type (WT), MyD88−/−, and TLR7−/− mouse BMM. a Structure of CT and R837. b WT (C57BL/6), MyD88−/−, and TLR7−/− mouse BMM were incubated in a CO2 incubator for 48 h with CT, R837 or LPS at specified concentrations before they were analyzed for the expression of CD80, CD86, and CD206 by flow cytometry. Shown are the overlay histograms of sham (black line) and treated (shadow) BMM. c Mouse BMM were cultured in the absence (sham) or presence of 5 μg/ml CT for 48 h before the supernatants were harvested for the measurement of indicated cytokines. Shown is the average (mean ± SD) of three independent experiments. *p < 0.05 and **p < 0.001. d WT, MyD88−/−, and TLR7−/− mouse BMM under M1 macrophage polarization condition (100 ng/ml LPS + 50 ng/ml IFNγ) for 24 h, followed by 10 μg/ml CT treatment for indicated time periods. The samples were analyzed by Western blot for I-κBα. The same membrane was re-probed with anti-GAPDH after stripping

