Fig. 2.
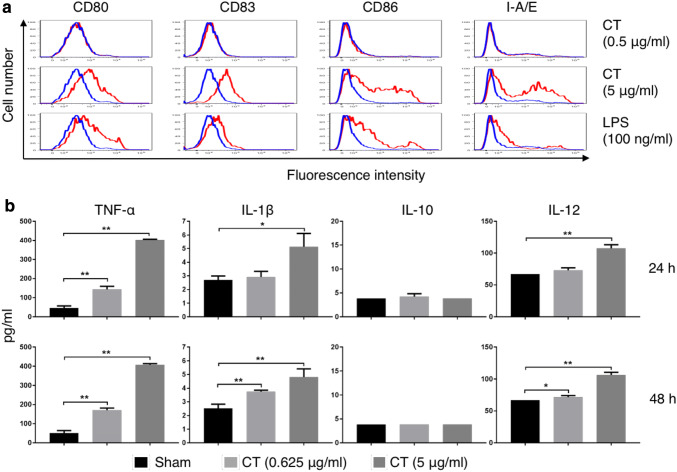
CT induced maturation of mouse DCs. a Mouse bone marrow-derived DCs were incubated in a CO2 incubator for 48 h with or without CT or LPS at the concentrations specified before they were immunostained for detection of surface marker (CD80, CD83, CD86, and I-A/E) expression by flow cytometry. Shown are the overlay histograms of sham (blue line) and treated (red line) DCs. b Mouse bone marrow-derived DCs were cultured in the absence (sham) or presence of various concentrations of CT for 24 or 48 h before the supernatants were harvested for the measurement of indicated cytokines. Shown is the average (mean ± SD) of three independent experiments. *p < 0.05 and **p < 0.001

